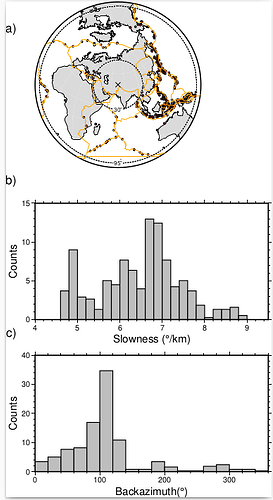
Hi! I generated the following plot and I am trying two things:
- Shift the the figure a) towards the center.
- Trying to enlarge the size of the paper in a way that the borders of the plots look a little bit better.
I haven’t got with the correct command? Do you have some suggestion?
Here’s is my script:
gmt subplot begin 3x1 -A+JTL+o0.8c -Fs10c/5c -M15p
gmt subplot set 0 #Subplot 1
centerN=36.75754 # latitude in degrees
centerE=69.8462 # longitude in degrees
map_radi=2.8i
map_horz=100
col_cont=217.6/217.6/217.6
col_plb=245.7600/204.8000/204.8000
gmt coast -Rg -JE$centerE/$centerN/$map_horz/$map_radi -Dc -A100000 -G$col_cont -Swhite -W0.3p -Baf
awk -F’ ’ ‘{print($1,$2)}’ Global_catalog.txt | gmt psxy -Rg -JE$centerE/$centerN/$map_horz/$map_radi -Sc0.08c -Gbrown -W.1p,black
gmt psxy PB2002_boundaries_GMTready.txt -JE$centerE/$centerN/$map_horz/$map_radi -Rg -W0.05p,orange
gmt psxy -JE$centerE/$centerN/$map_horz/$map_radi -SE- -W.8p,white -Rg << EOF
$centerE $centerN 6660
$centerE $centerN 21090
EOF
gmt psxy -JE$centerE/$centerN/$map_horz/$map_radi -SE- -Wblack,- -Rg << EOF
$centerE $centerN 6660
$centerE $centerN 21090
EOF
gmt psxy -JE$centerE/$centerN/$map_horz/$map_radi -Sx0.3c -W0.5p,black -Rg << EOF
$centerE $centerN
EOF
gmt pstext -JE$centerE/$centerN/$map_horz/$map_radi -F+f7p -Gwhite -Rg <<EOF
70 -58 95\217
70 -353 30\217
EOF
gmt subplot set 1,0 #Subplot 2
awk ‘{print $3}’ HIST | gmt histogram -Bx+l"Slowness (@./km)" -By+l"Counts" -BWSne -R4/9.5/0/15 -Ggray -W1p -Z1 -T0.2
gmt subplot set 2,0 #Subplot 3
awk ‘{print $4}’ HIST | gmt histogram -Bx+l"Backazimuth(@.)" -By+l"Counts" -BWSne -R0/360/0/40 -Ggray -W1p -Z1 -T20
gmt subplot end
gmt end show
Thanks in advance!!
