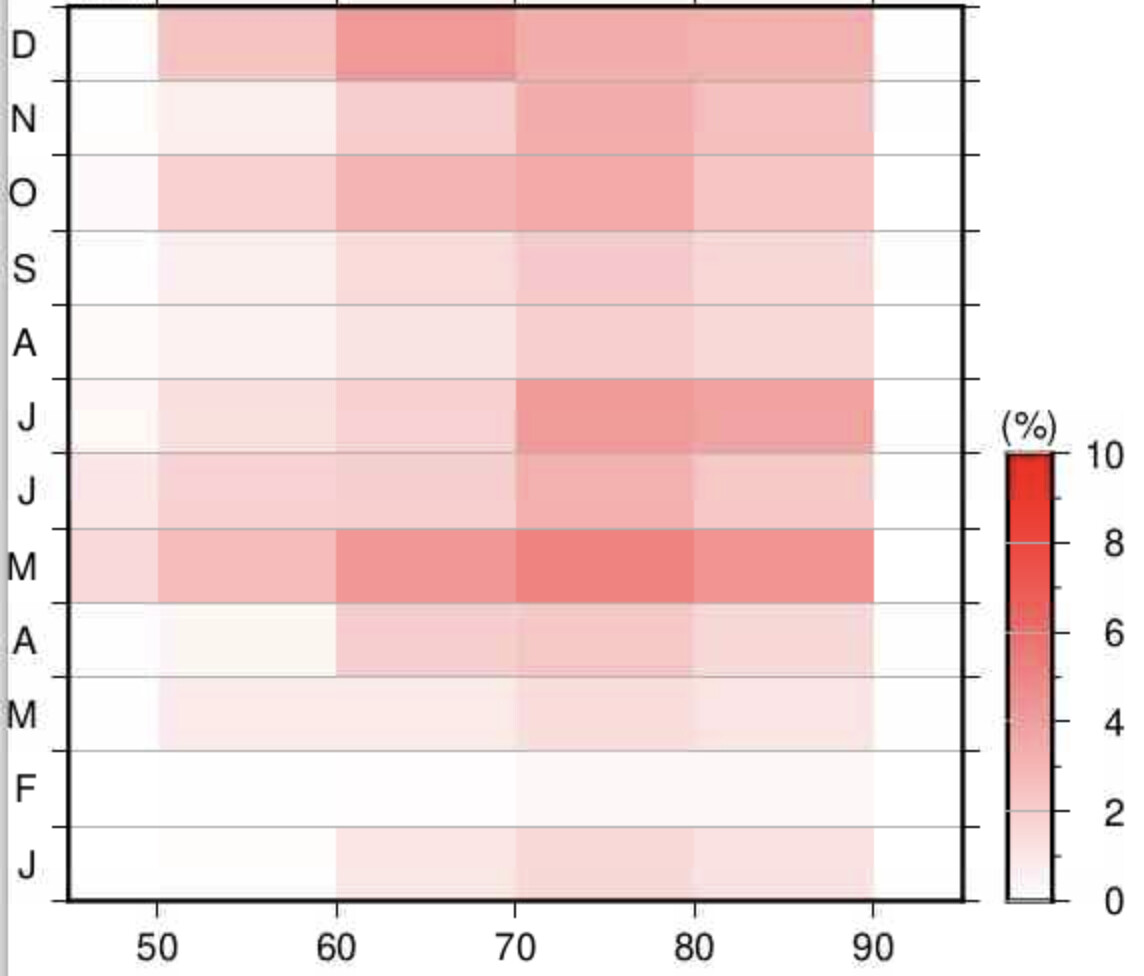
To plot this, I have a netCDF file containing a 2D matrix [x,y,freq] with :
x = beginning of a bin which spans 10 degrees
y = month number
freq = the frequency within the box (for example 6% between 75-85º in March)
The thing is, the tiles on the plot are shifted by 5 degrees to the west… e.g. the first tile [45-50] which is supposed to be [45-55] but is [40-50] instead, thus is truncated.
Is there a way to correct that (maybe I’m not using the proper module)?
Give -Gnew.nc so you can see what is created. Hard for me to tell since your file is probably not COARDS compliant if you just wrote it in MATLAB. Better to fix your matlab script to make a proper grid output, but see if -T works for you.