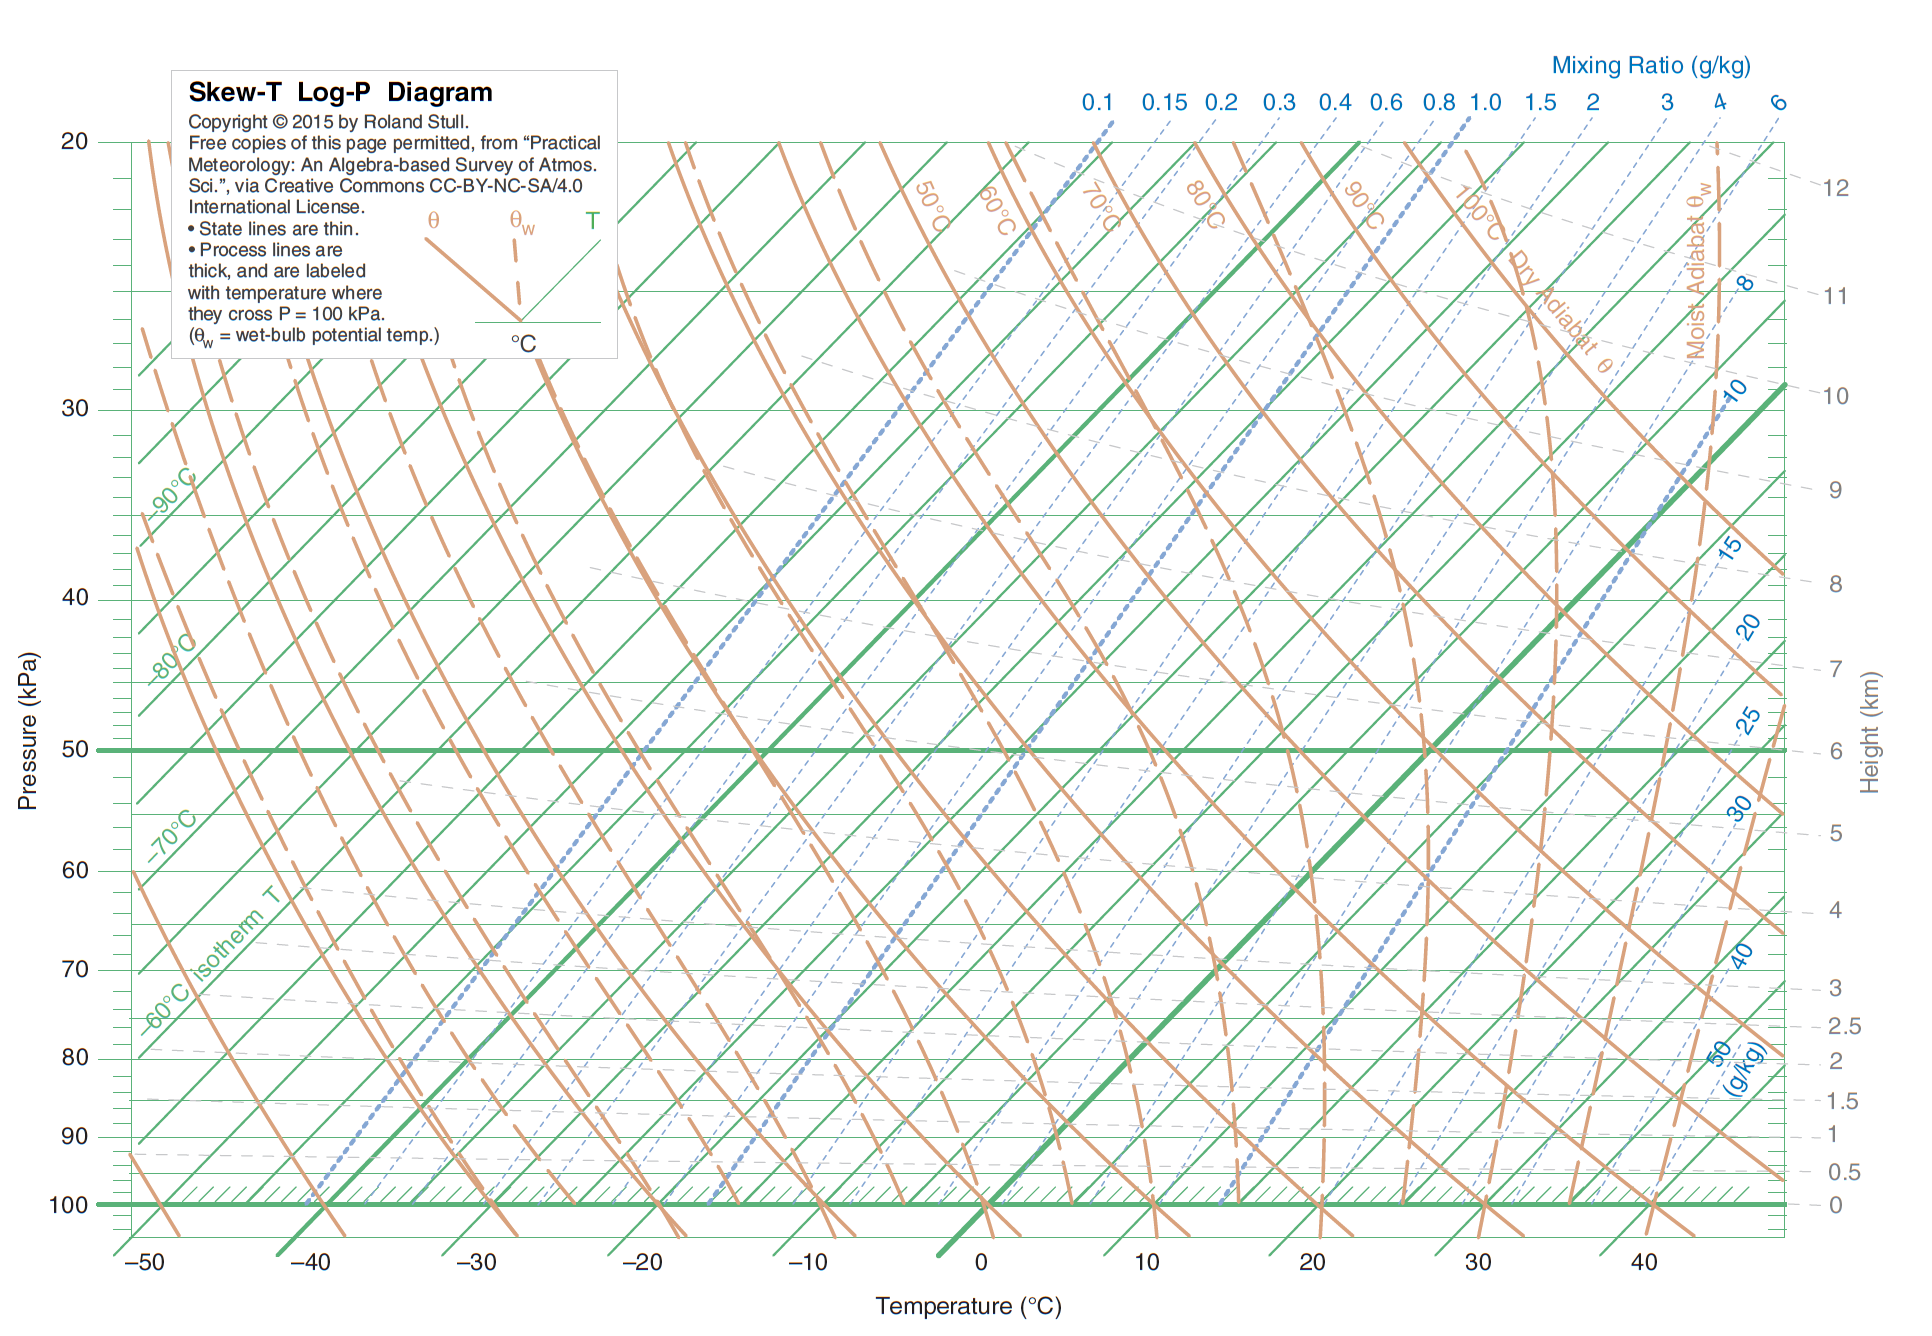
Has anyone ever tried creating a GMT script to plot a Skew-T Log-P thermodynamic diagram of the type used by meteorologists to plot atmospheric vertical soundings?
In principle it seems like it could be possible, but might require a new type of map projection? The vertical axis is skewed to the right, similar to an oblique projection.
I haven’t made a Skew-T diagram, but I did write a script to make a tephigram. Unfortunately, I cannot find the code right now, but here’s how I did it.
I started with a series of T, Td and P data from a radiosonde or NWP model. Once these data were in a text file with one row per vertical level, I then put them through an awk script which converted the (T,P) or (Td,P) into the (x,y) coordinates on the paper. Nowadays people might use something like Python. Then it was simply a matter of drawing the curves using the -Jx projection. Actually it was a bit harder - as you appreciate. There may be scaling of the coordinates, and in the case of the tephigram the whole thing is rotated so the isobars (which are curved) are almost horizontal.
The hard part is the saturated adiabats. There is no analytic formula for these (there are probably approximations - but I computed them numerically). You’ll need to create a function to solve the coordinates for these. If speed is of the essence, it may be faster to save the coordinates in a file for reuse each time you plot a new sounding.
Then the rest is making things pretty by adding the labels and so on. You’ll probably spend the most time on this :-).
I’ve tried to locate the final plots too, but cannot find them - I may have some at work. The end result was very pleasing, and the tephigrams were used as images for certificates given to volunteer observers in a field program I was on.