Hello all
Thank you for hosting this place, it’s been very helpful to adapt and achieve things. I’ve come to a stagnant point, though. It has to do with cross-sections and projections. I need to do at least 2 of them, one of which is topography/bathymetry, which thankfully I could incorporate into my cross section.
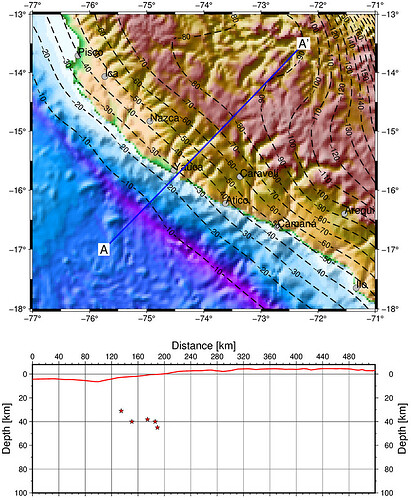
What I haven’t been able to achieve is putting the projection of the slab1.0 model (ideally, I would include that model and some others too). I do have a previous plot made with GMT, but I was sure that it could be achievable.
When trying to do the track on the slab, it adds no new data to the dataframe, and actually it results as a dataframe with no data, other than the new column “slab1”.
#extract the depth of the slab1.0 into the track and add it
track_df2=pygmt.grdtrack(
    grid="Slab1.0/sam_slab1.0_clip.grd",
    points=track_df,
    newcolname="slab1",
)
it gives this error message:
grdtrack [WARNING]: Some input points were outside the grid domain(s).
I’m attaching both the jupyter notebook on which I have everything (in .txt format due to limitations on sharing here, maybe I could upload it so someone else can download it from a cloud service such as google drive). And also an image of the result of the GMT code on the slab.
Thanks in advance!
PS: I have another minor question about the colors of the stars on the cross-section. Now they are all red, but when I tried to give a different color to each one of them, an error message saying that I couldn’t have a list of colors if my data was a file or variable I think.
PPS: Sorry if this post is clumsy, I think it’s my first question here ![]()
pygmt_2013_planta_y_sección_V2.0.txt (6.7 KB)

