Hello folks,
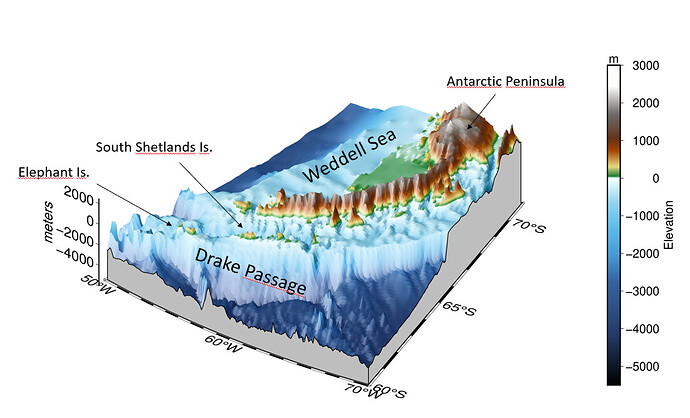
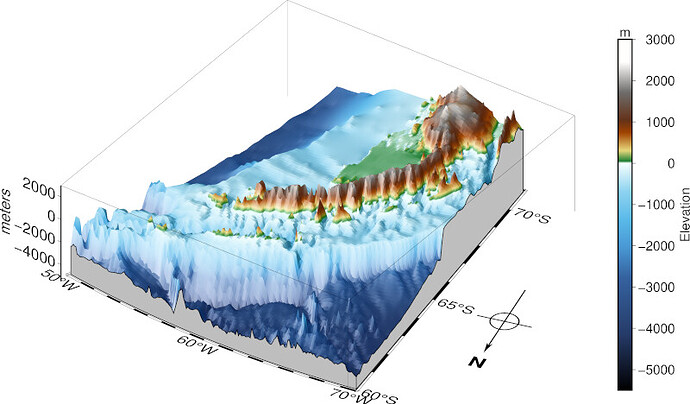
When I saw the publication by Dorschel et al. (2022) with the new version 2 of the IBCSO, I took advantage of the rainy days here to produce some 3D maps of important gateways in the Antarctic Peninsula using PyGMT. The notebook is here and I created a repository to facilitate later versions.
I would love it if someone could review and suggest improvements.
best wishes
5 Likes
Nice.
It seems that the is a bug in the vertical axes (the one with the meters). It is a bit separated from the frame.
Nice example @andrebelem!
Do you want to list your example at the PyGMT site (https://www.pygmt.org/dev/external_resources.html)?
Thanks @Esteban82 and @seisman
Yes ! I think it will be great to list it the PyGMT site. However I need to solve these bugs.
@Esteban82, I think the vertical axis bug is due to the use of “xshift” in grdview. When I plot the figure without shifting it, the plot is cutted in the middle.
Another point is when I use ‘surftype=“i”’, the surface is also cropped (why?).
Feel free to test in your computer. May be is something with my installation. However I tested yesterday in Binder and it looks with the same bugs.
Thanks in advance for comments and help;
@Esteban82, I have already an answer about the “bug” (which is not a bug).
By adding a “+b” to the frame (like “WseNZ+b”), I can draw a bounding box around the perspective picture. Note that it is a rectangular box. The answer as to why the z-axis is shifted is the metric combination (z) with the projection (-JL) “deforms” the 2D geographic plane into the z-plane over the bounding box created in figure . So the axis will certainly appear to be offset from the corner of the figure.
So it’s not a “bug”, it’s “stylish”.

Actually I think it is a bug. Though cubes (+b) only make sense when framing cartesian coordinates (plus Mercator and how many more?), the vertical axes should be exactly on the corner(s). Funny that this situation never appeared before.
I think it is a feature (a bug with seniority). Drawing the box or cube implies orthogonality. The thin lines that are drawn are straight lines, even though the south border is an arc. The bug would be that we are allowing this option on non-rectangular projections. Perhaps we should give an error instead, or a warning at least.
Thank you for the explanation. I really see it as “style”, perhaps a small acceptable shift for this type of projection. It’s really unusual to combine a non-rectangular projection with a 3D perspective. But interestingly this combination received several "Wow"s as it allows an interesting view of topography at high latitudes.
I think a warning message would be important. In any case, I added this warning to the notebook.
I still think it’s a bug that the vertical axis is not plotted exactly at the corner. And as I said before this is a separate issue to the cube.
Hum… I’m a little bit confused about “how to do this”. @seisman, I read the instructions on how to do a PR at https://www.pygmt.org/dev/external_resources.html but I’m still confused as to how to add an entire repo (I have two now: https://github.com/andrebelem/PlanetaryMaps, which goes a little deeper into building maps of Mars and this one from IBCSO https://github.com/andrebelem/3D-Antarctic-maps).
When I go into PyGMT’s external examples repository, I don’t see where exactly to suggest a PR of main. It seems to me that there are several active branches.
Any help ?

