Hello everyone,
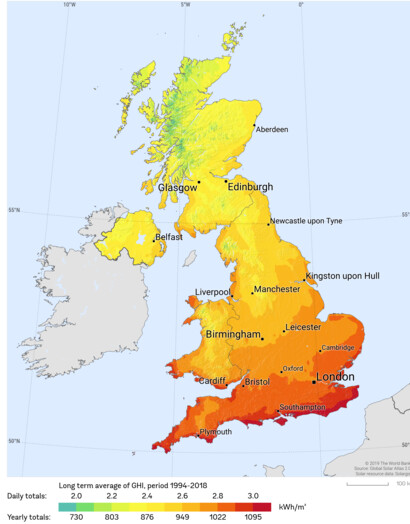
I have a number of data across a number of UK cities (London, Aberdeen, Birmingham, etc.). I want to plot them onto a map and then use something like a “contour map” to get something similar to this.
How can I plot my point data like a spatially continuous map using the spatial interpolation in PyGMT to get such kind of map?
Thank you for your help!
Look up blockmean, blockmedian or blockmode to interpolate and then use surface to visualise.
1 Like
block* are data decimators, not interpolators. surface is an interpolator. grdimage visualizes a grid. You would also need toset up clip paths surrounding the UK via coast.
1 Like
Thank you very much for the reply, which is quite useful!
Thank you for clarifying this, much appreciated!
