STRM data is apparently NAN over the ocean and outside the 60 S… 60 N latitude range.
BTW Why don’t you plot your DIFF.nc? If you were patient enough to subtract two multi-Gb grids, you can surely plot it. Likely just grdimage DIFF.nc would be sufficient for the beginning.
Try adding coastlines on top of it.
“STRM data is apparently NAN over the ocean and outside the 60 S… 60 N latitude range” : I think this is for 1s and 3s but I use the original grid with 15s which has data over ocean.
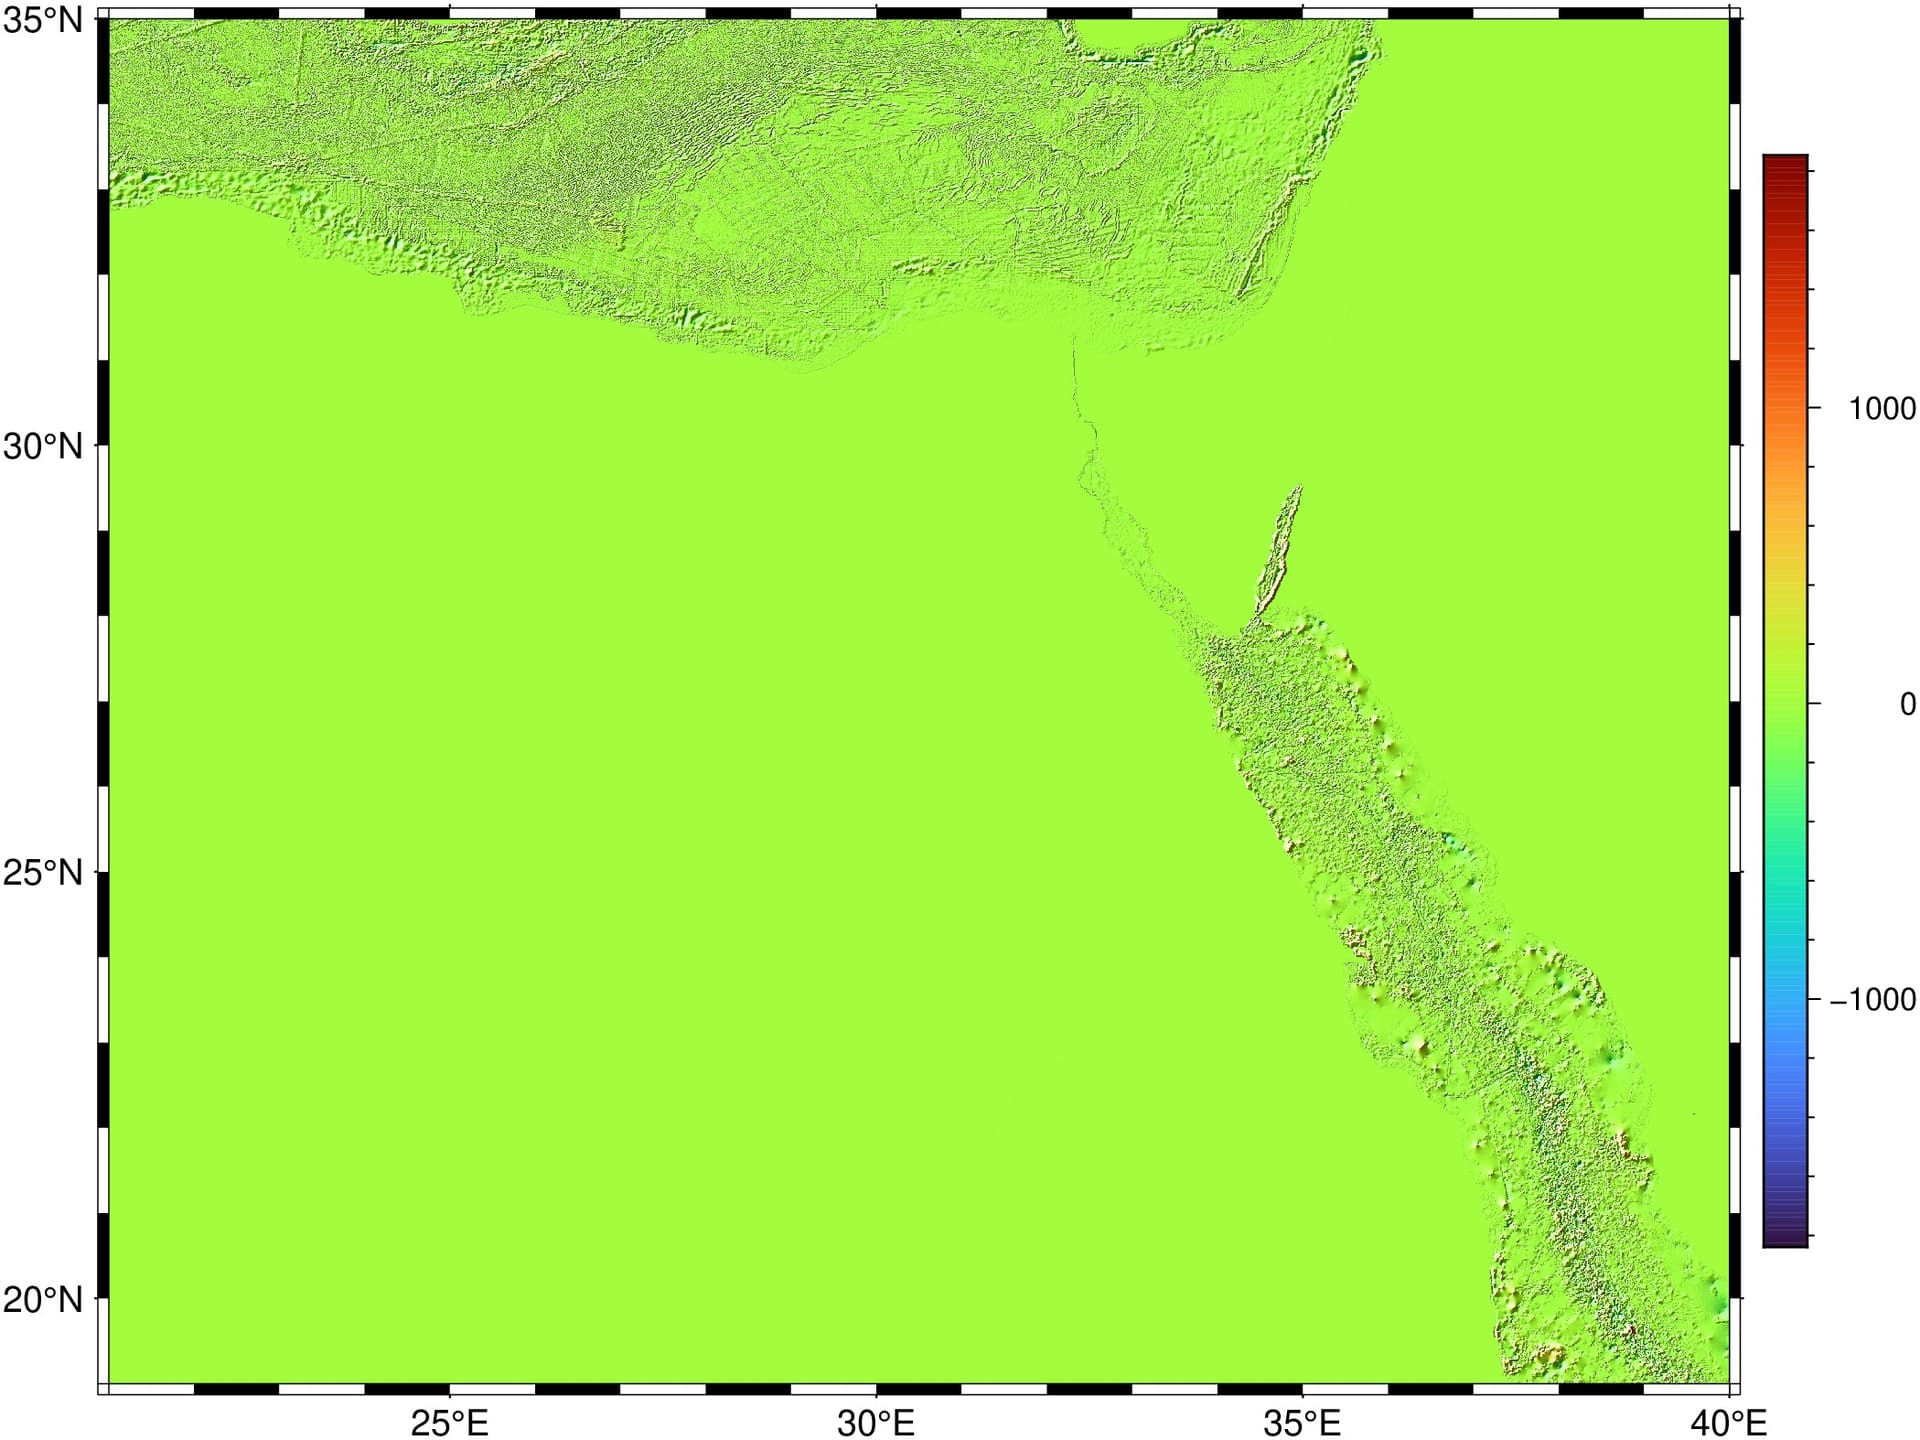
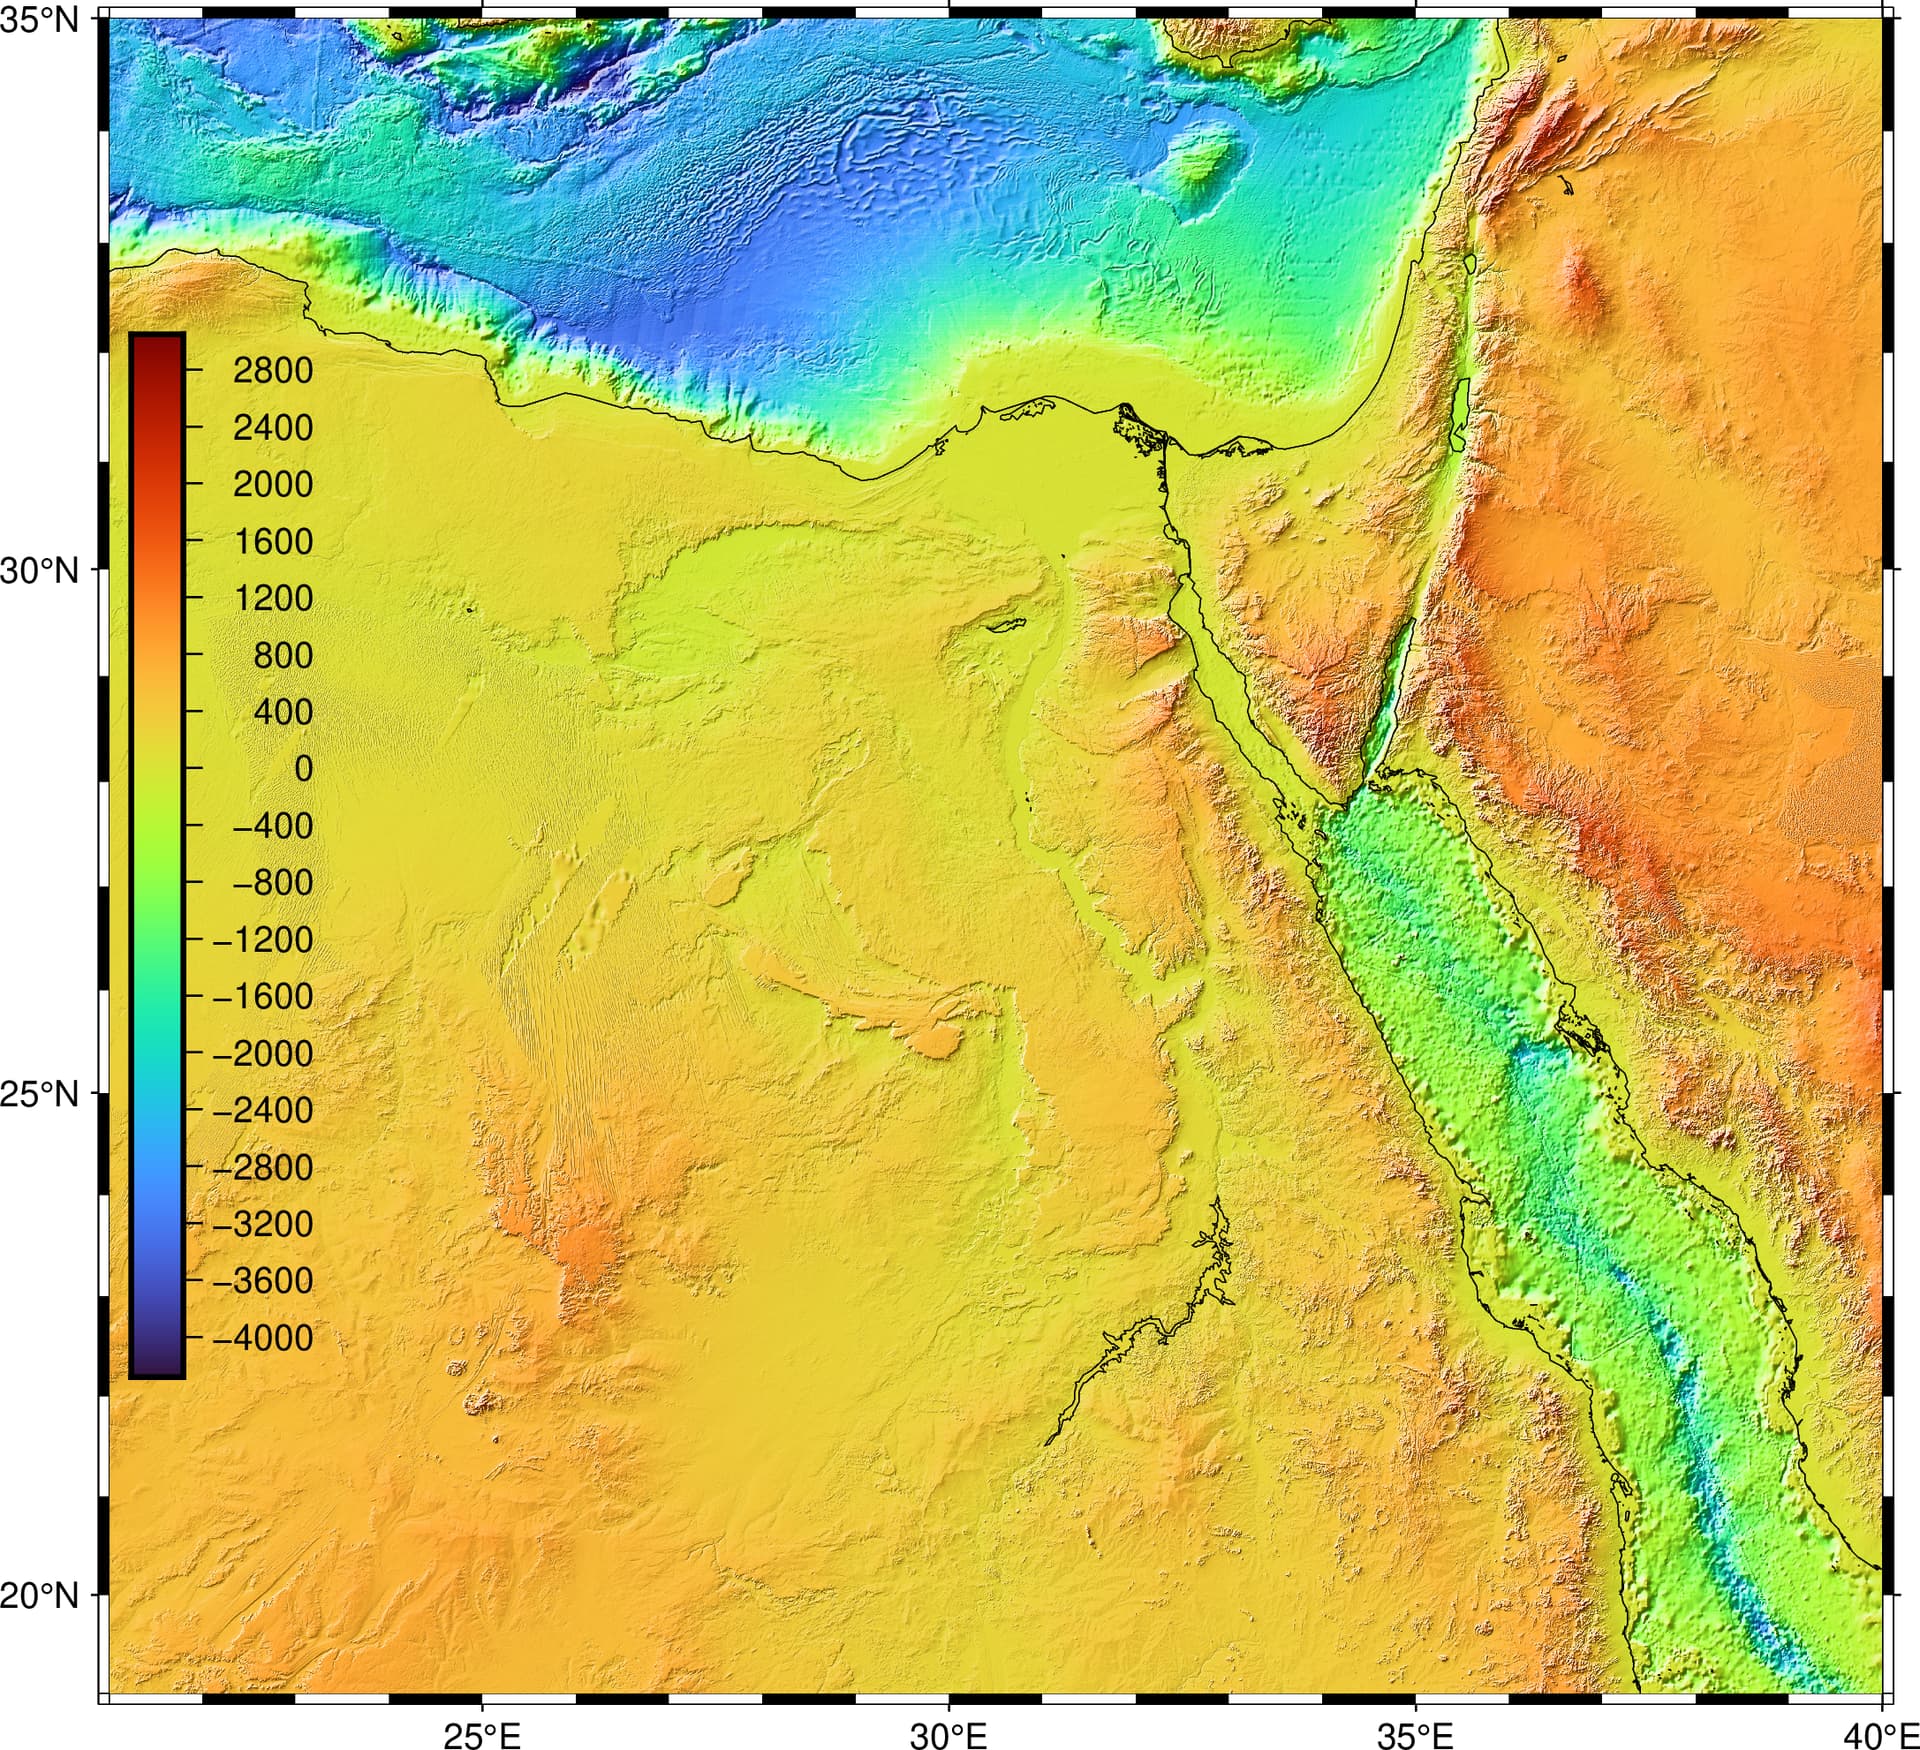
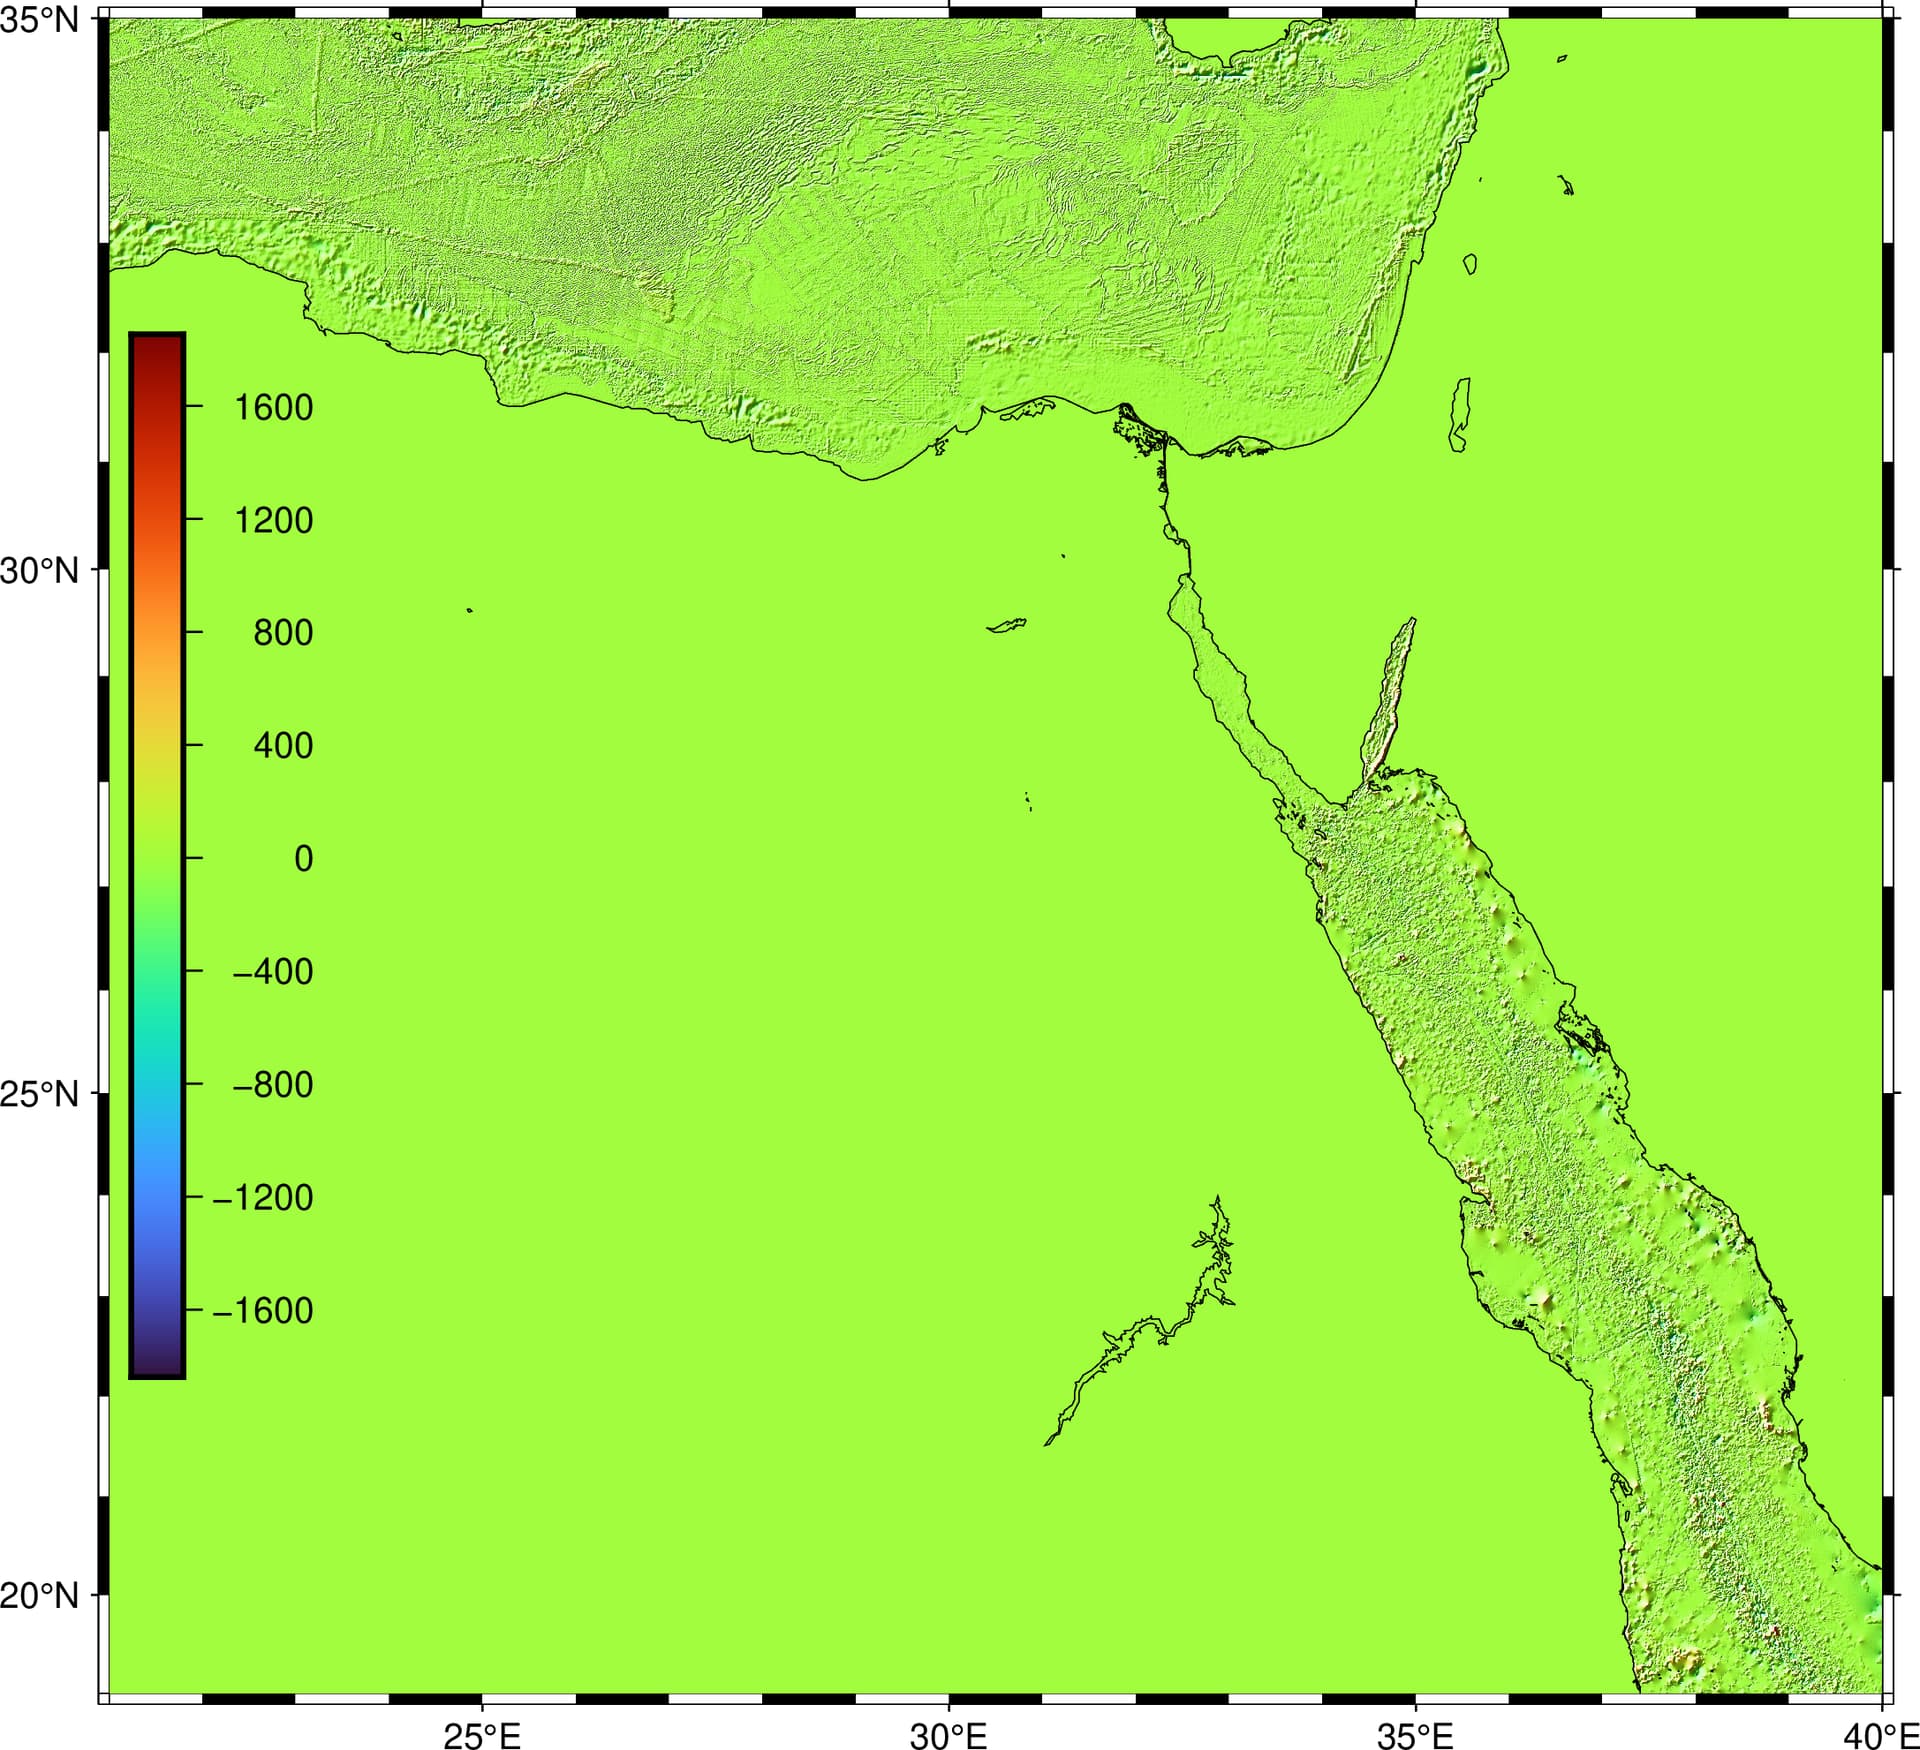
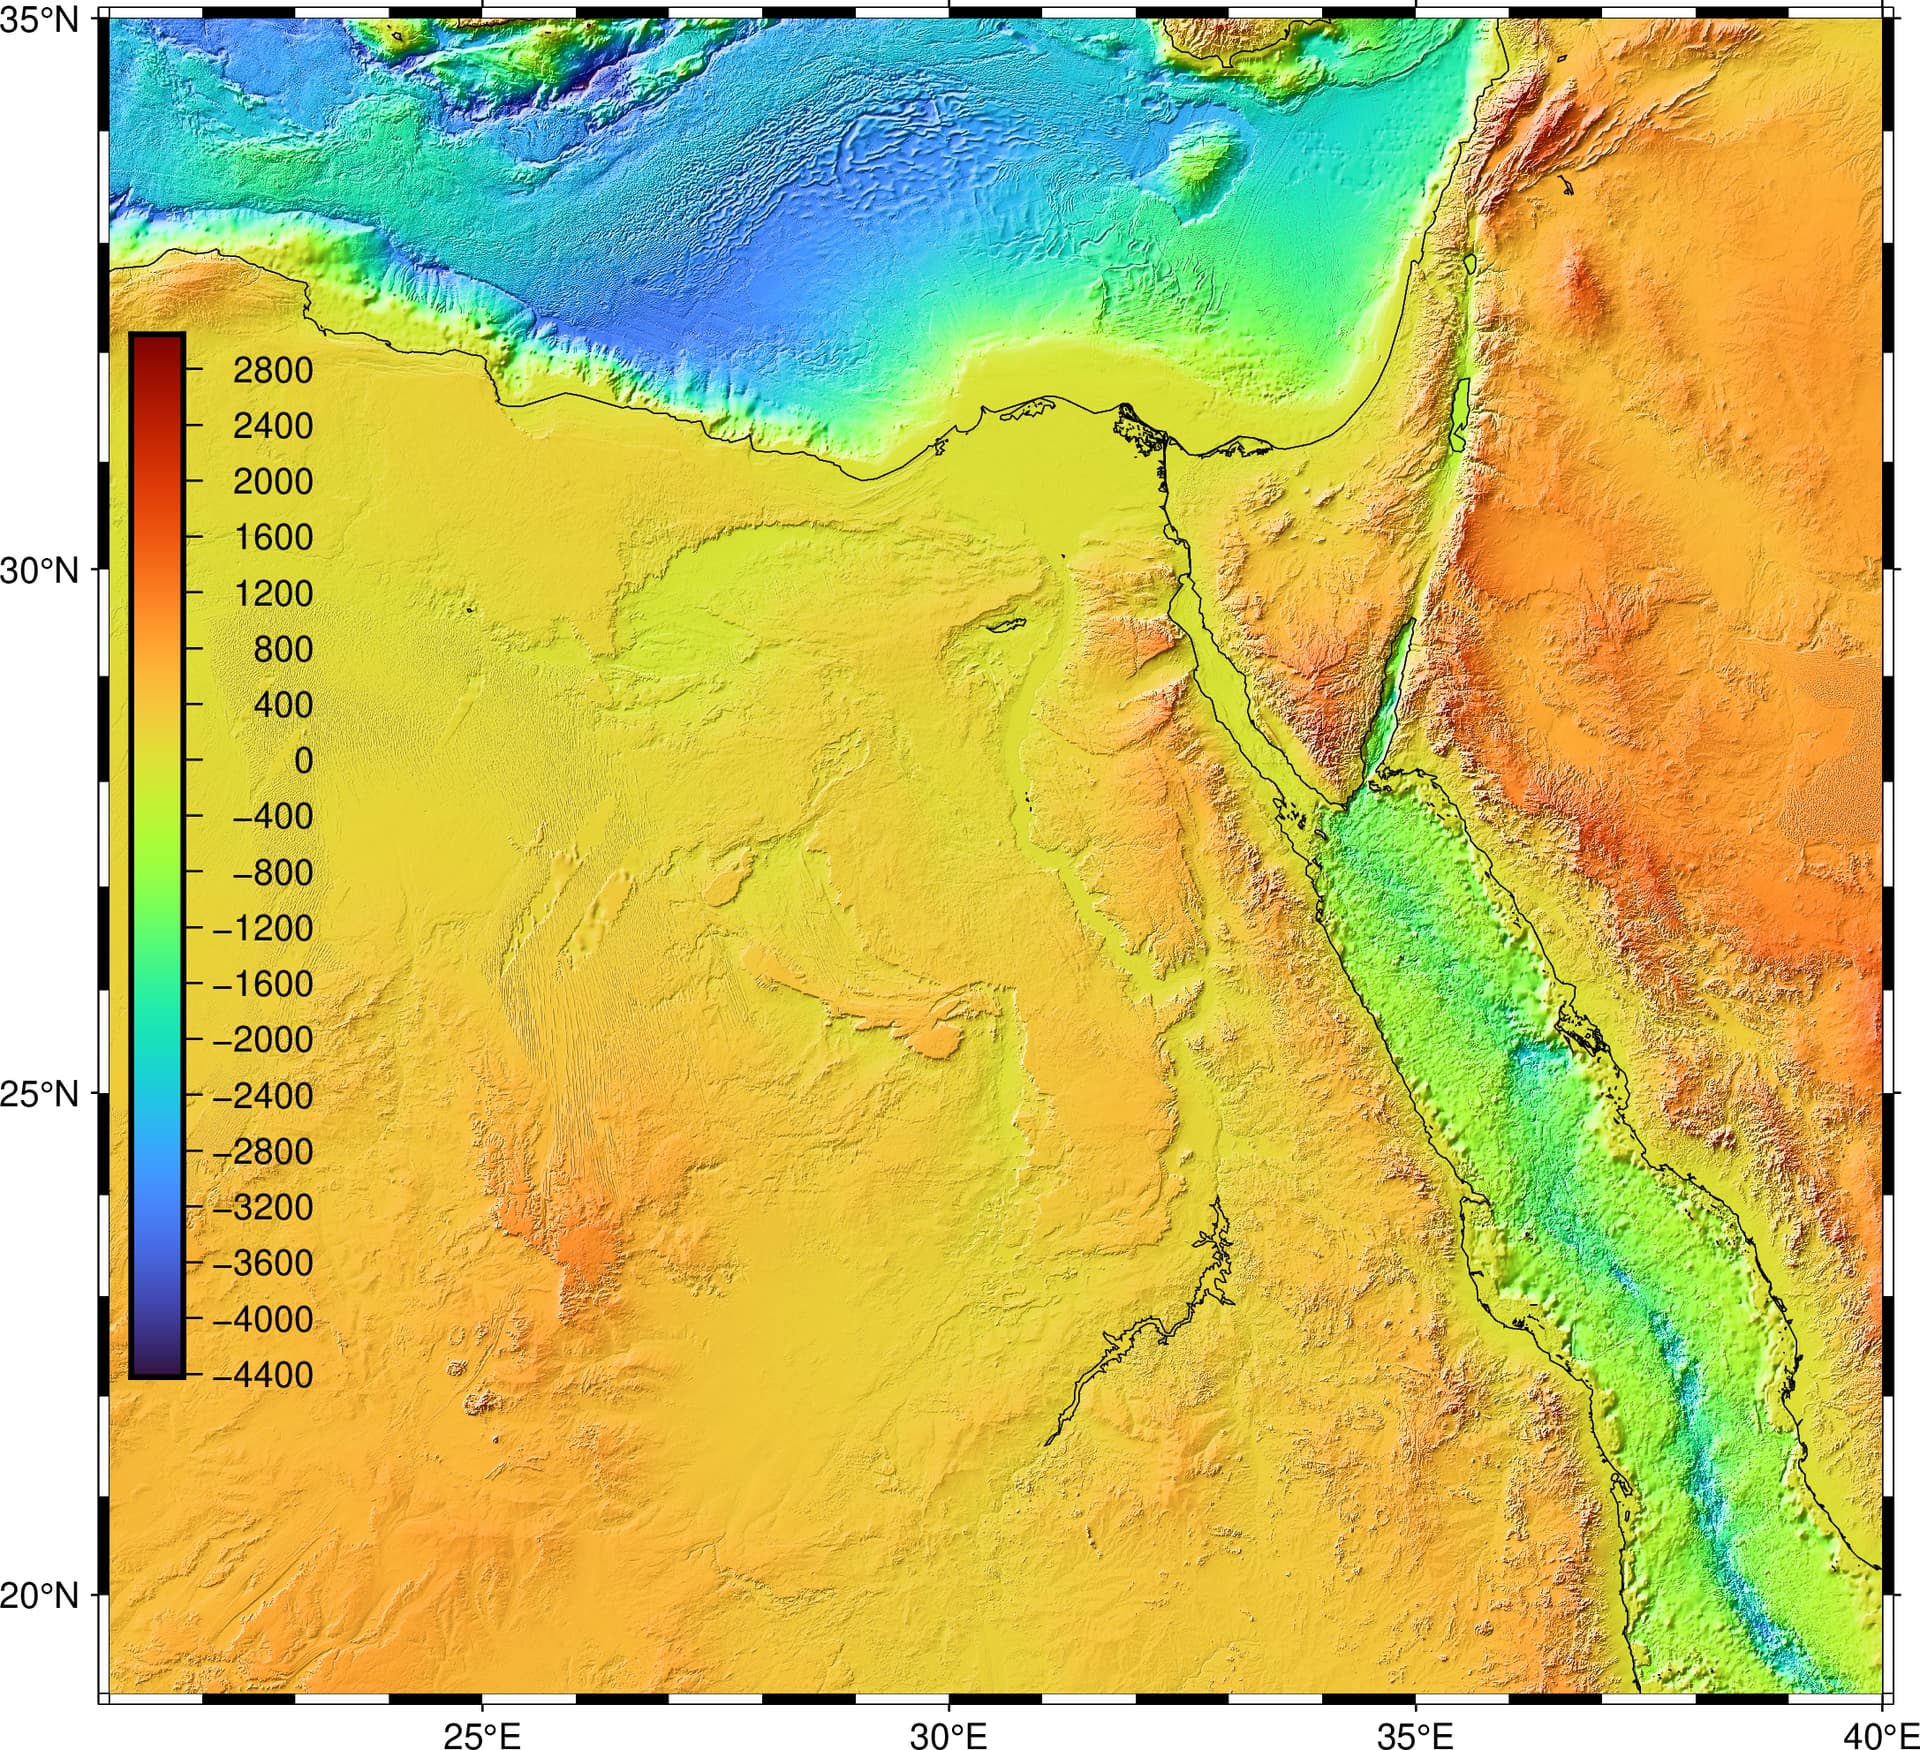
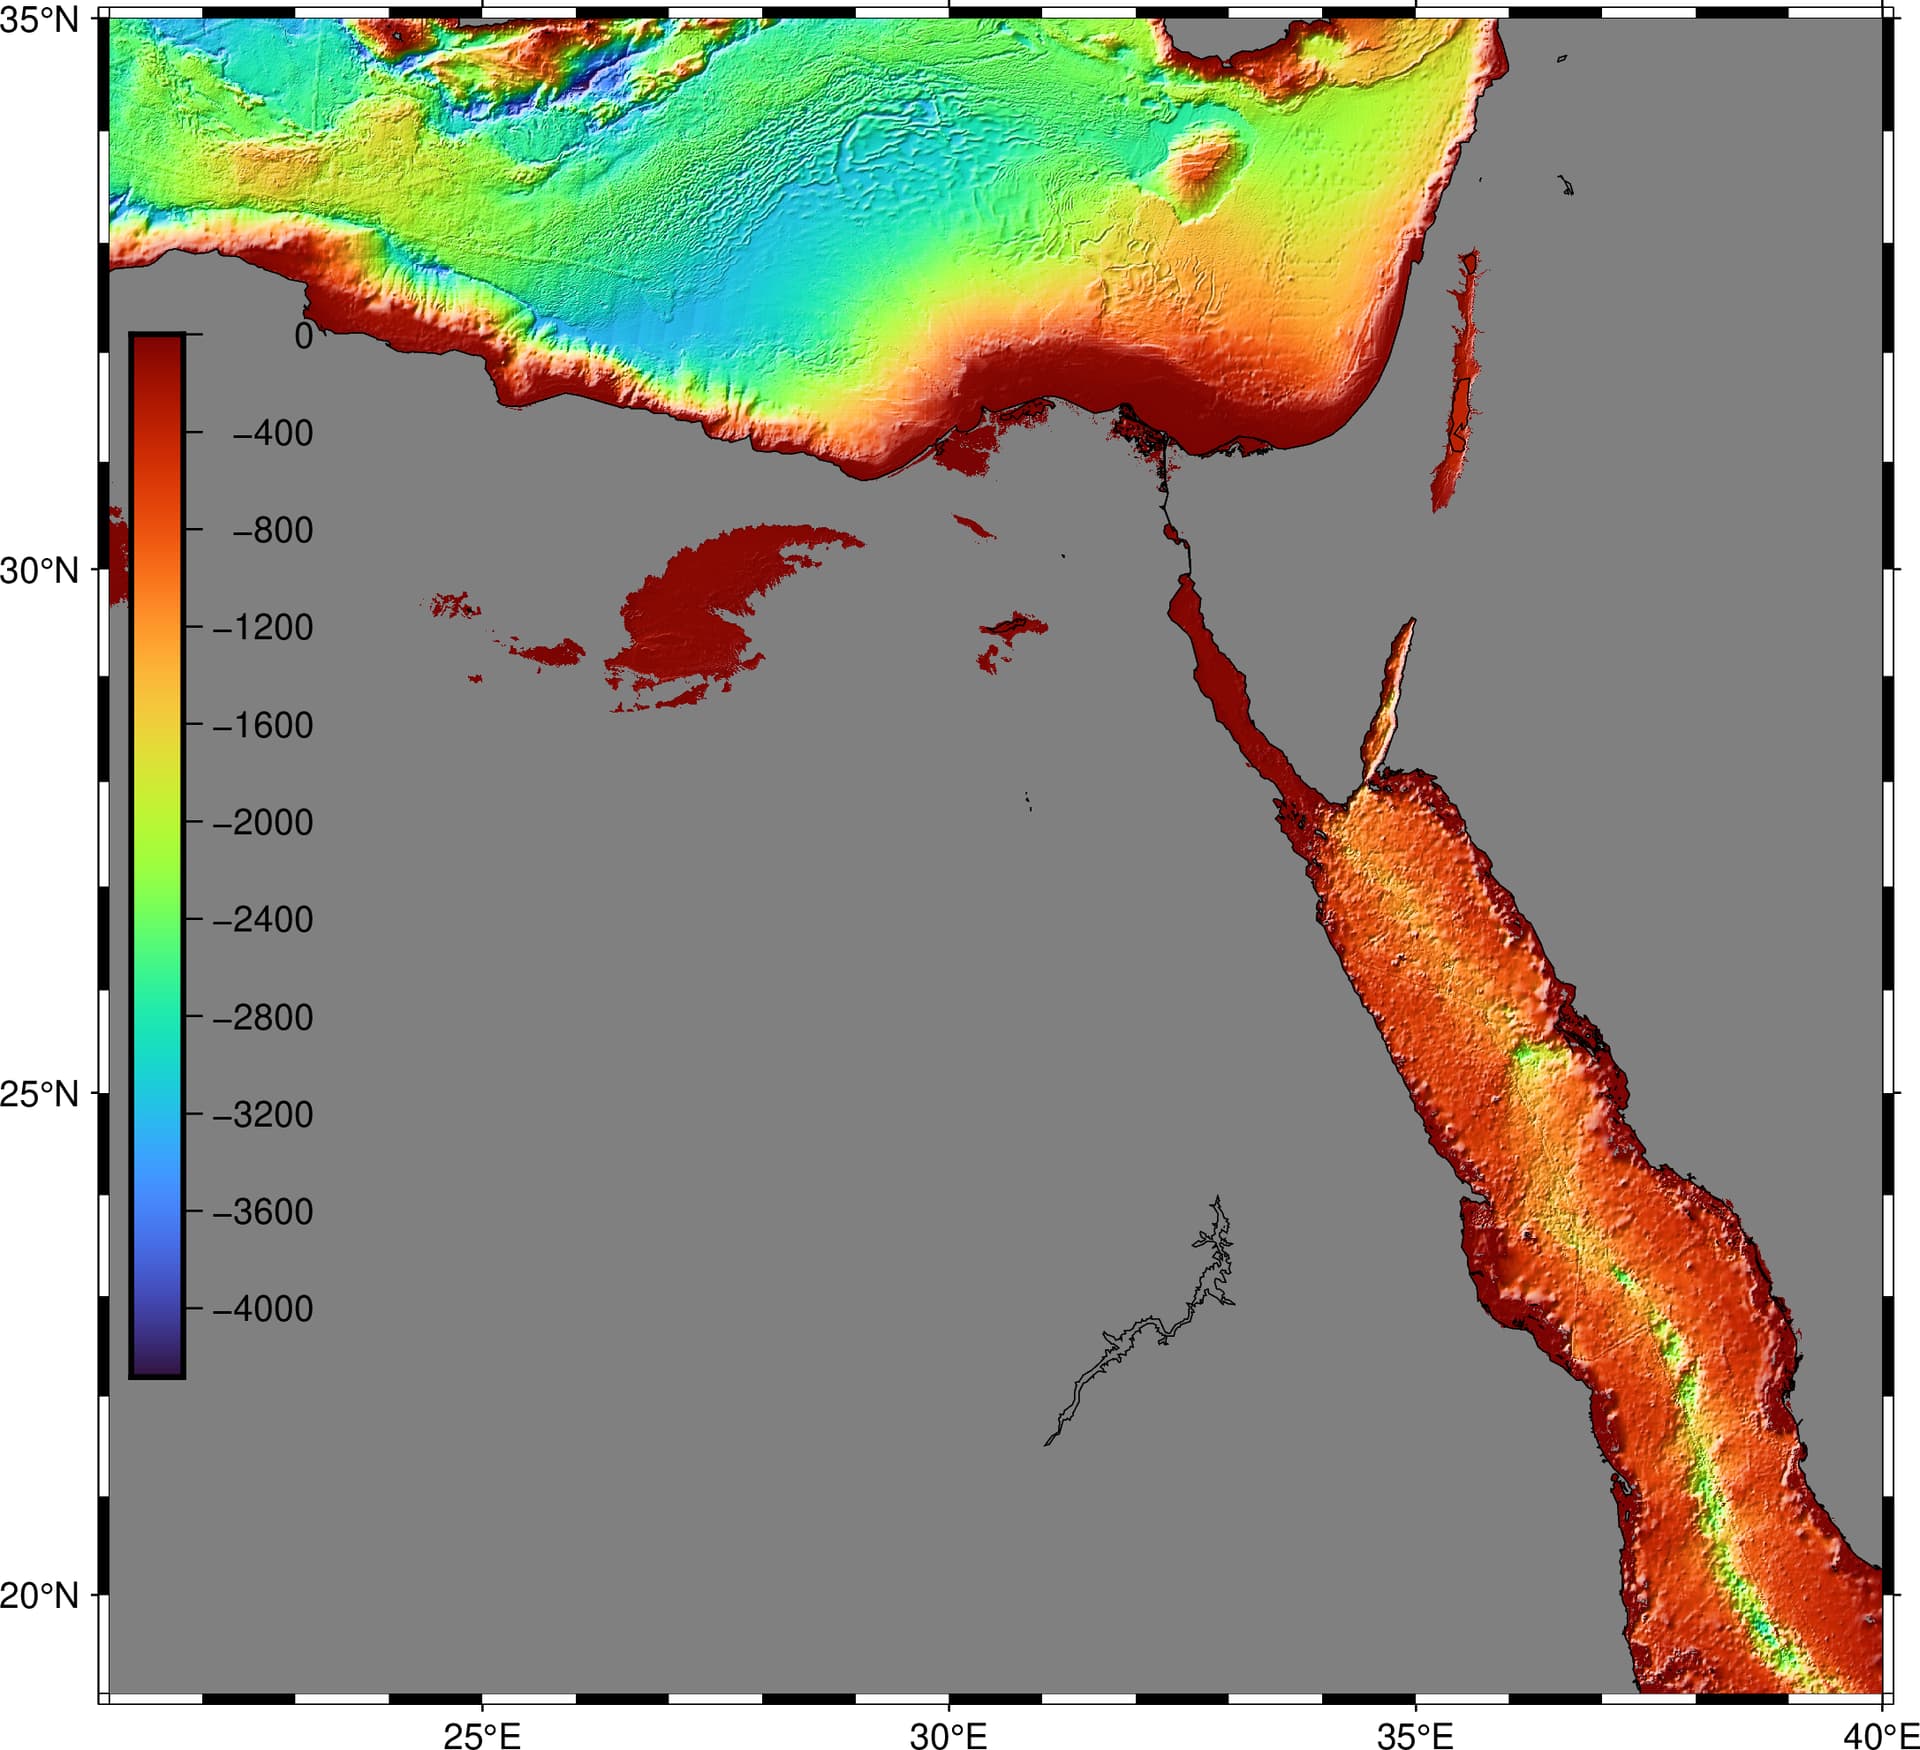
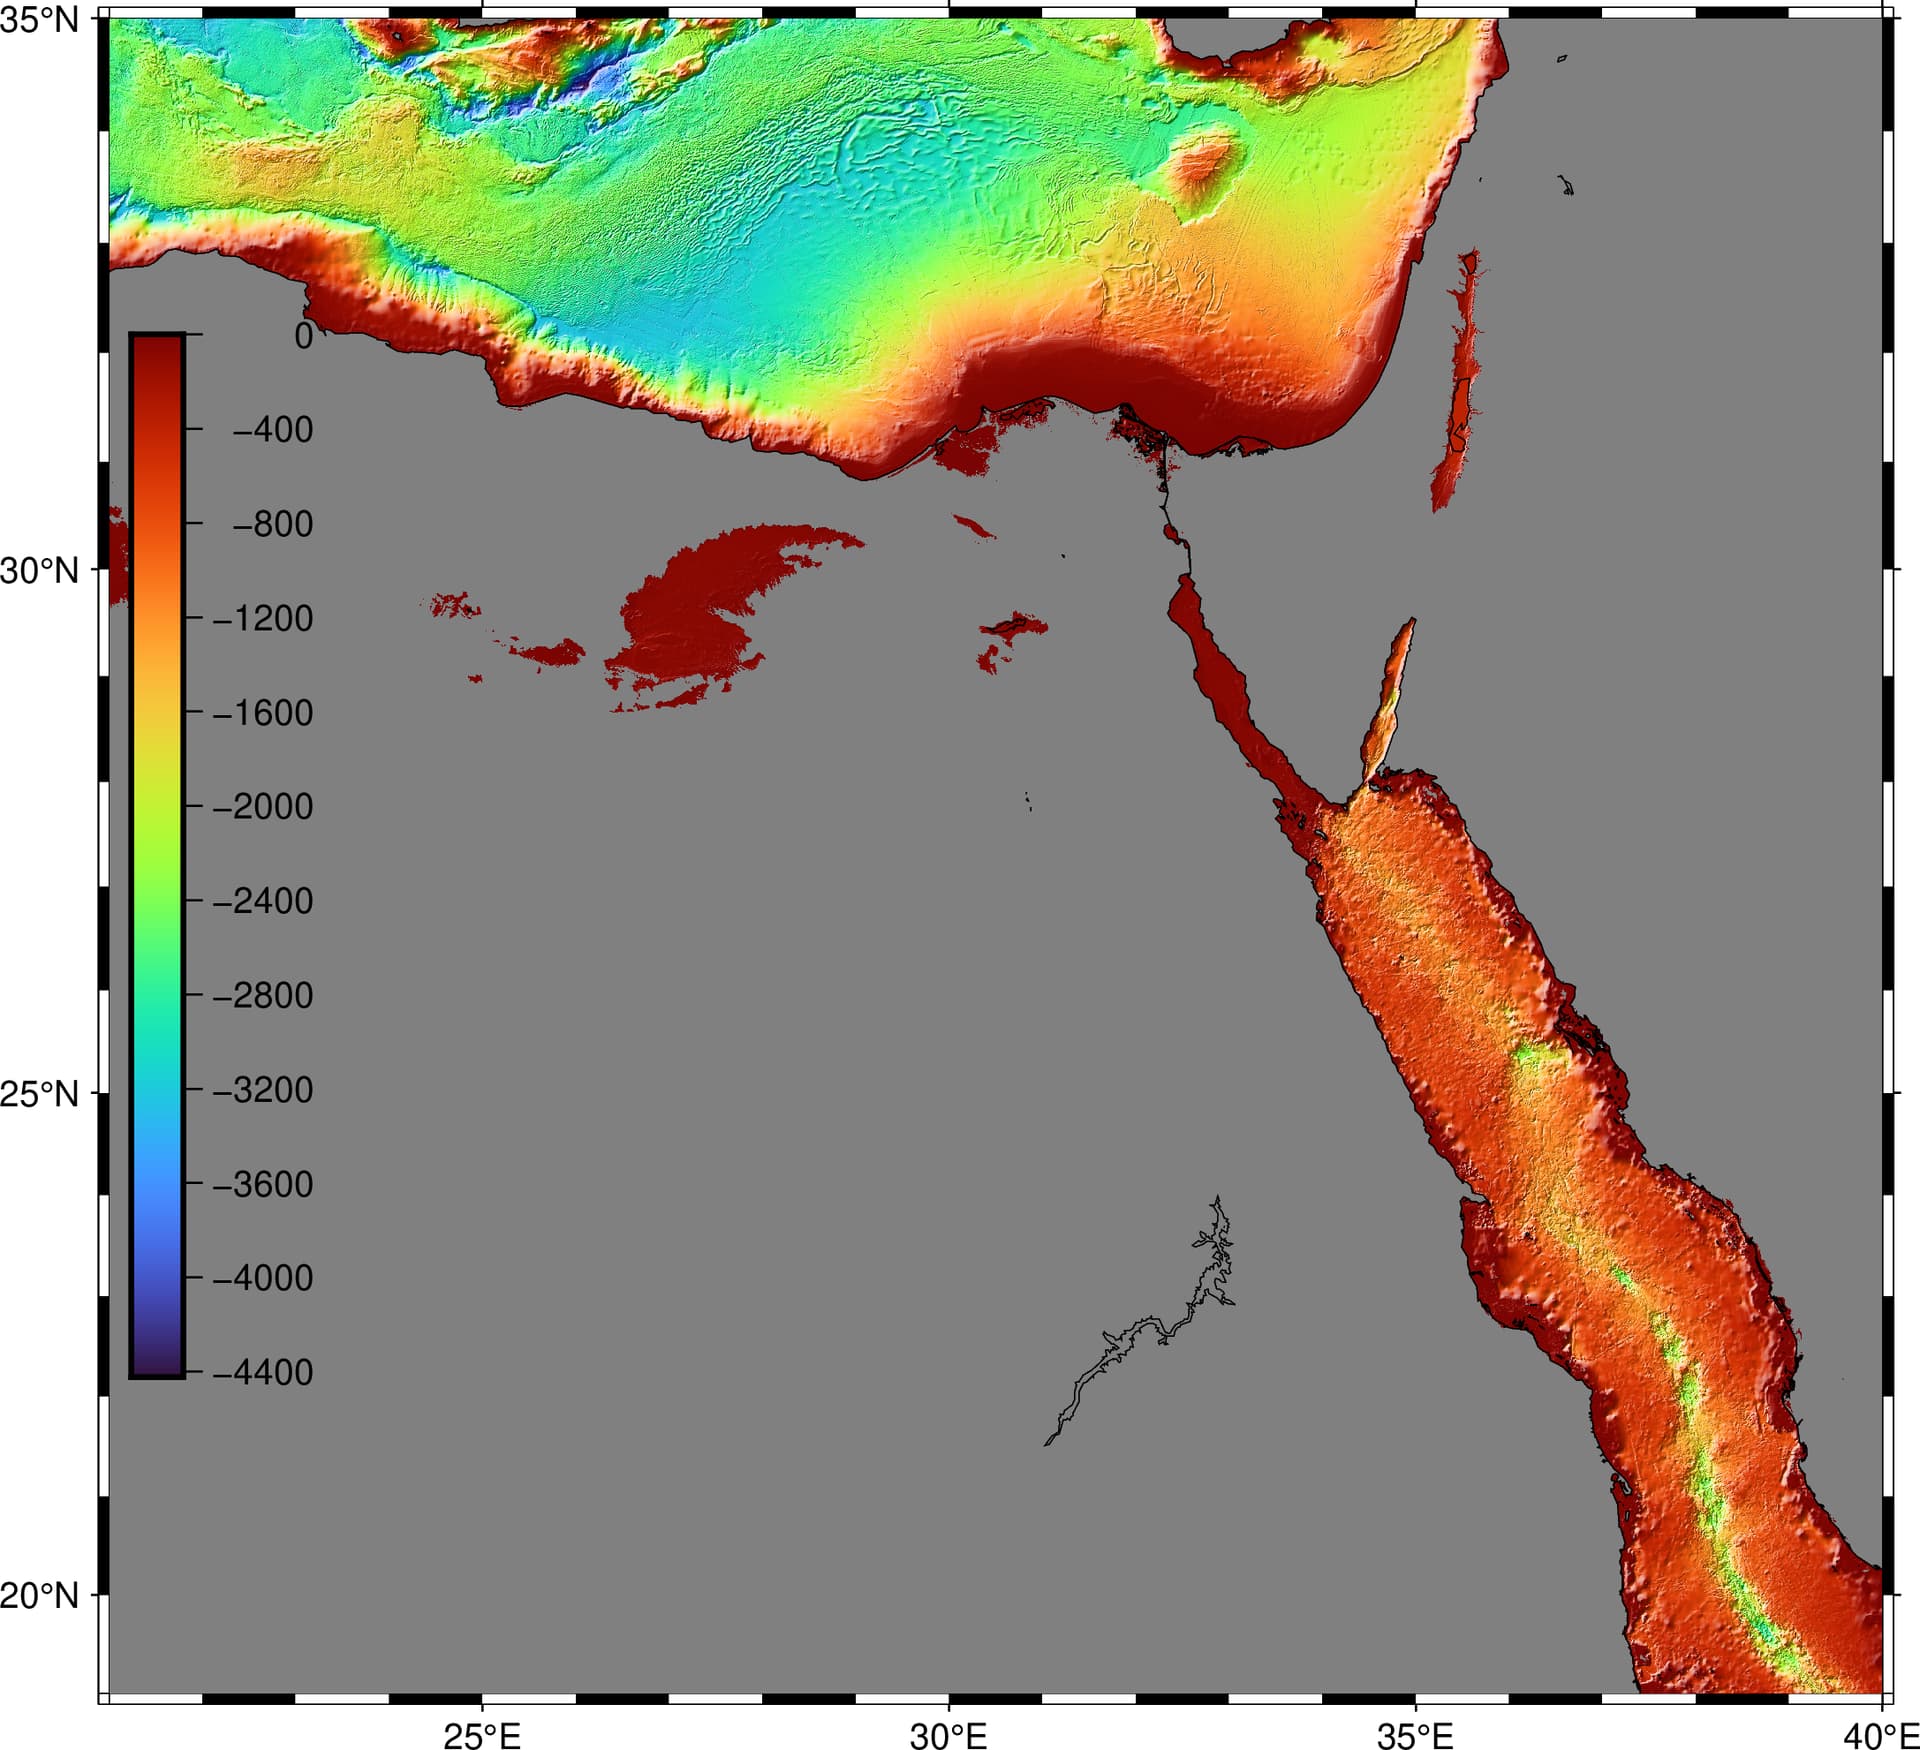
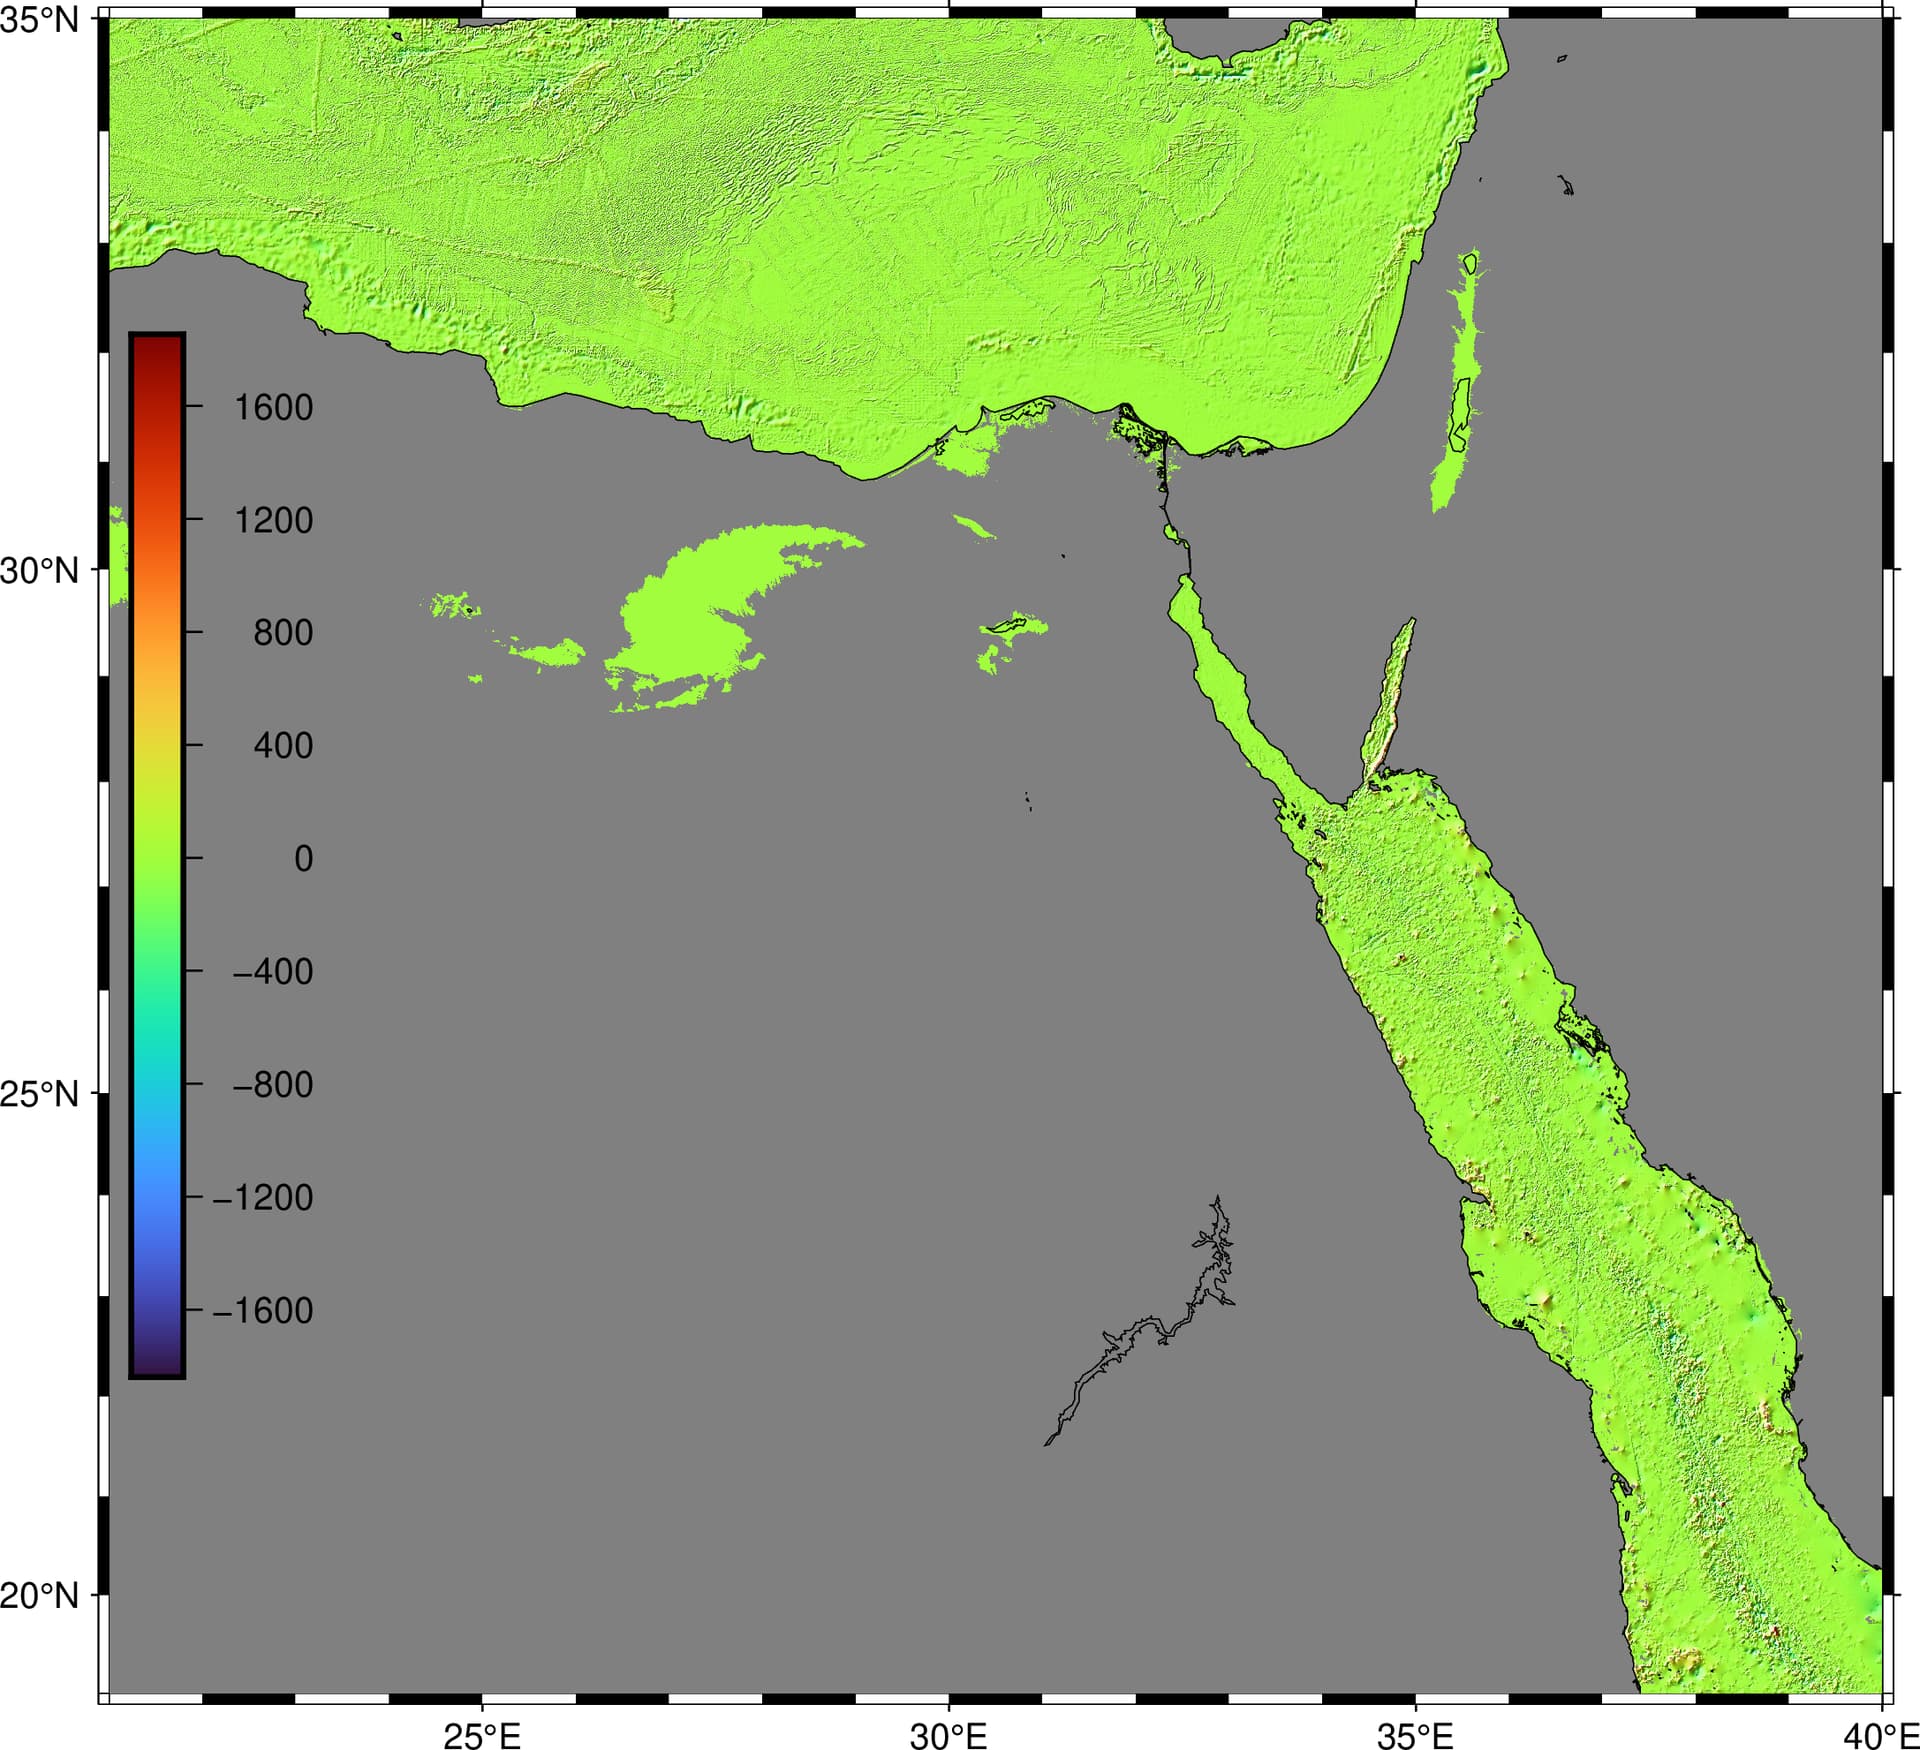
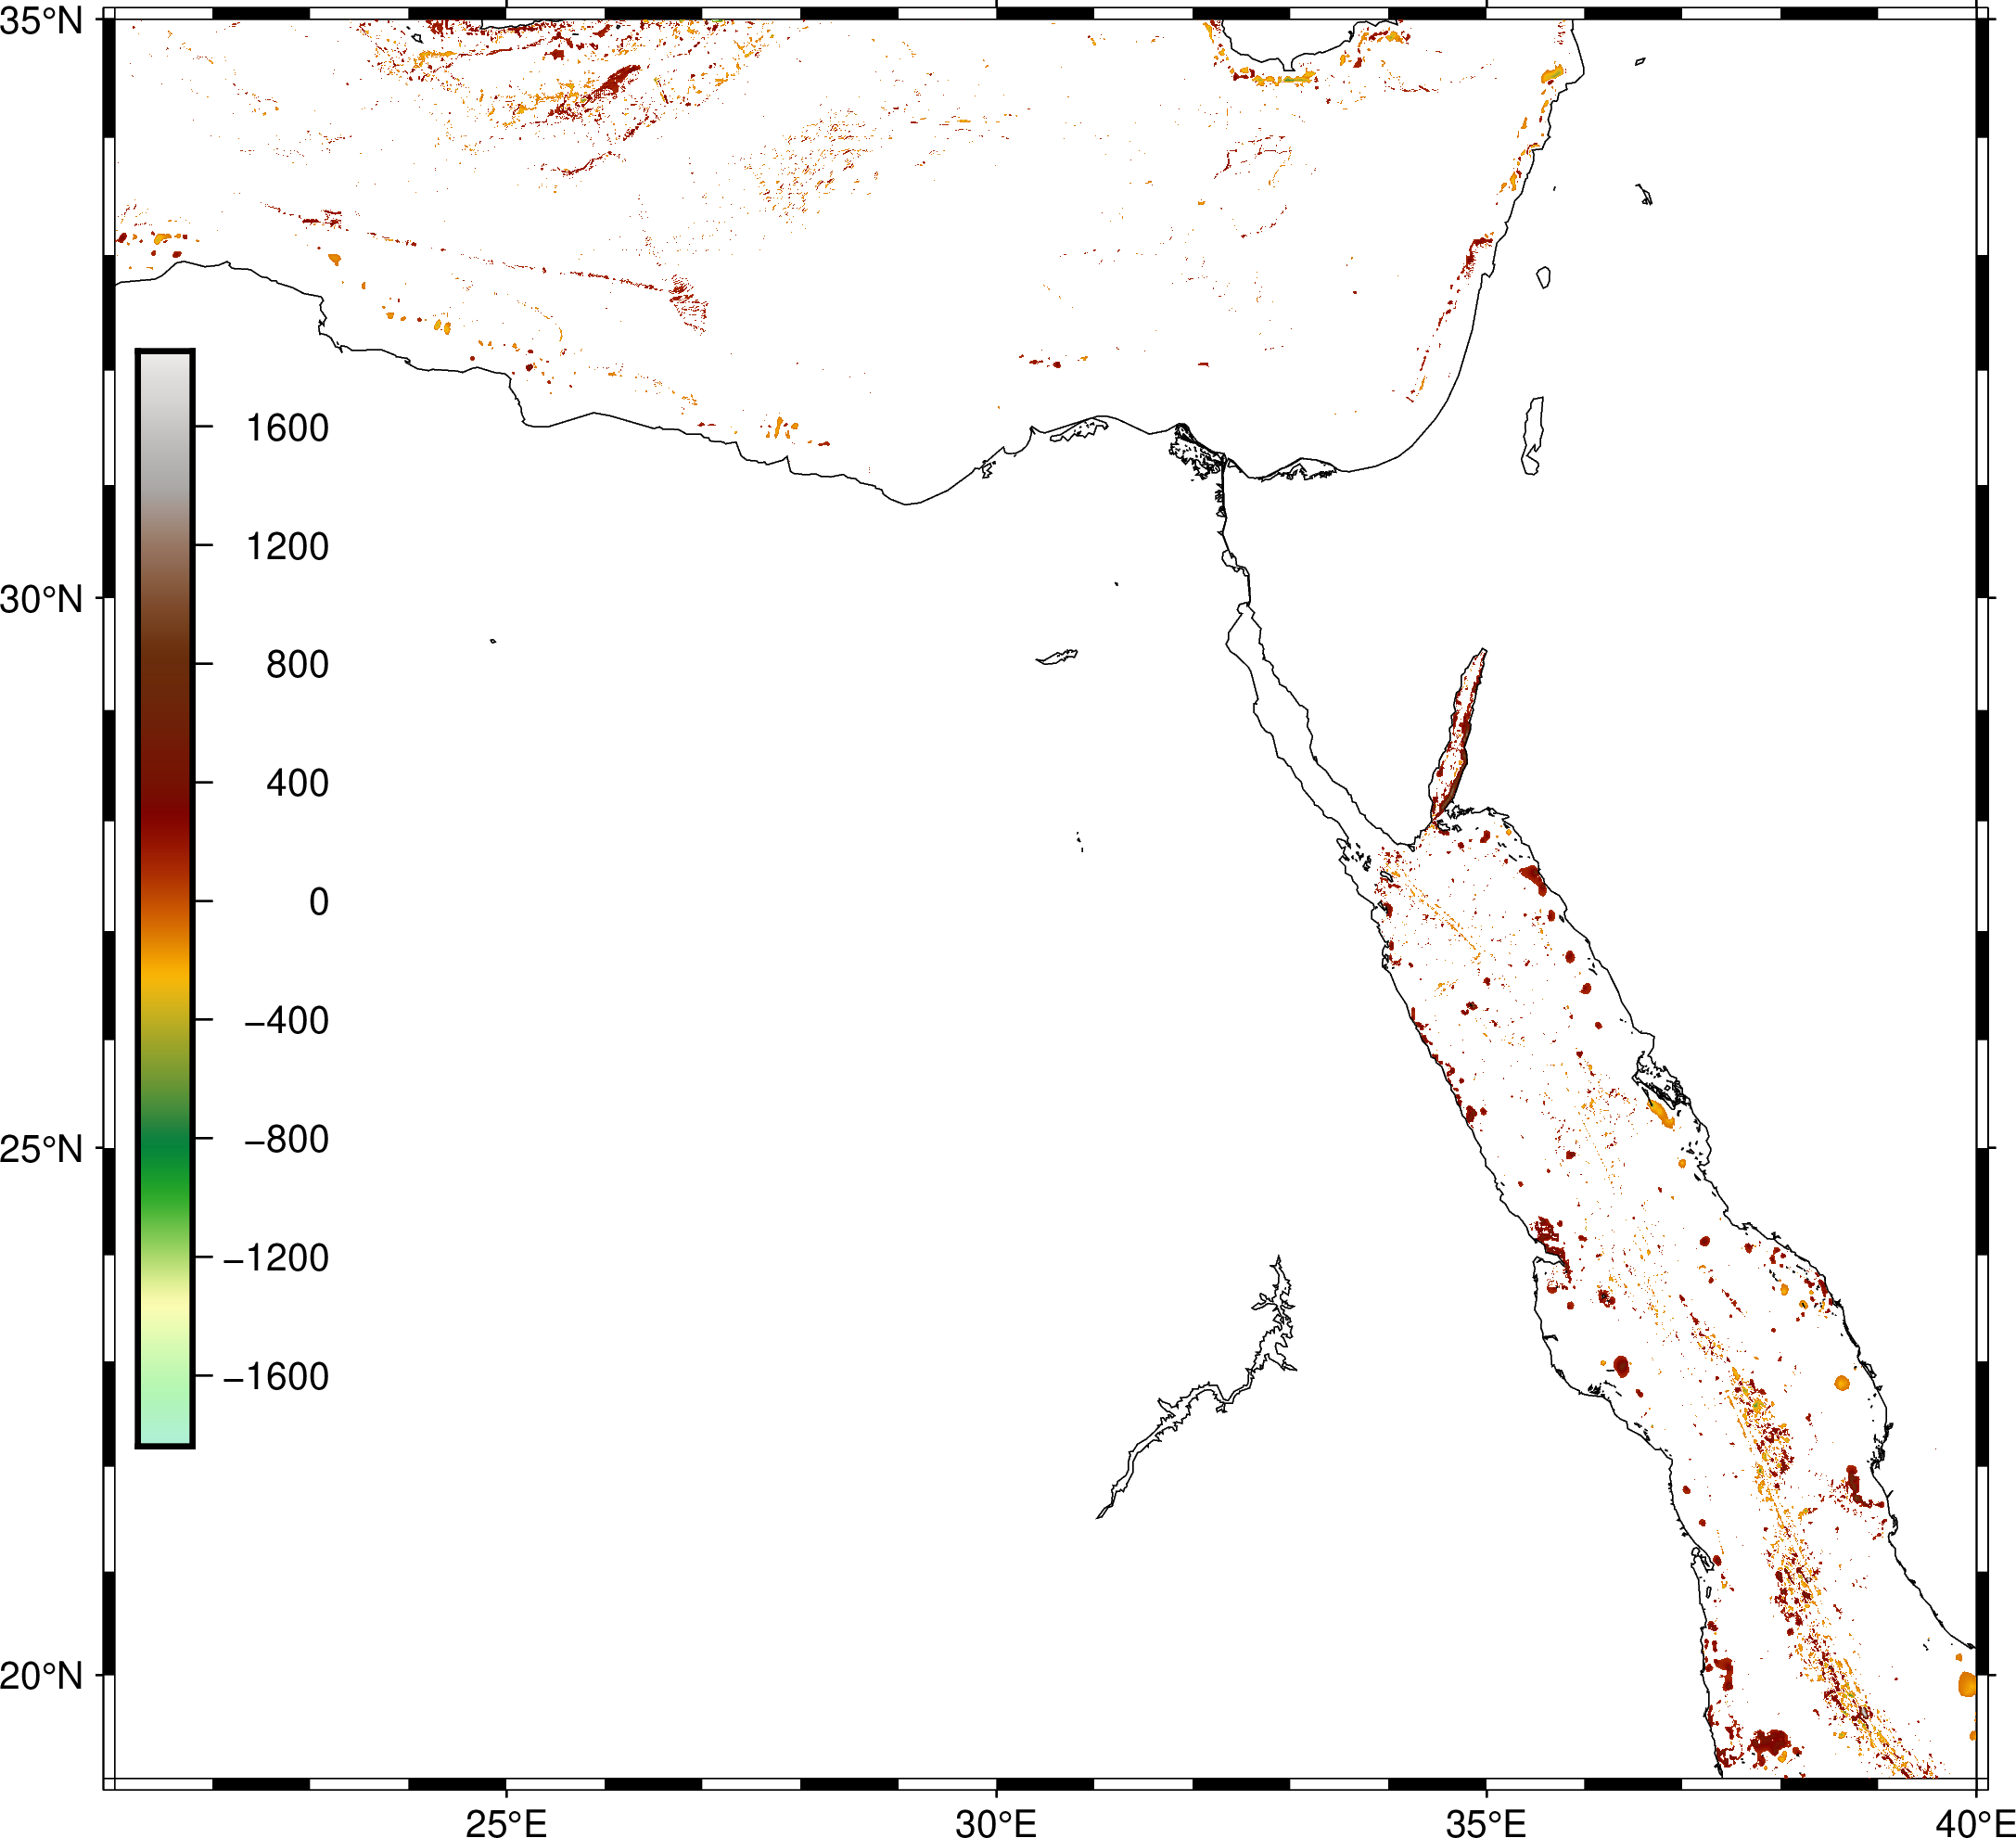
below the three figures of SRTM, GEBCO, and DIFF.
the figures show a clear shift in water data while keeping exact data over land (see colorbar).
NB: the differences for the whole water area are big not just some outliers or coastal zones.
I don’t have time now (I don’t have time to all issues being discussed) but would like to remind that GMT does not produce that data. It provides an easy way to redistribute it (though sometimes we do some data processing to make things possible/better - like filling ocean areas where original had no data, e.,g. SRTM’s 1 and 3
It appears SRTM data @15s redistributed by GMT has water areas filled in. I might be wrong but I don’t see such a fill-in coming from anywhere other than GEBCO bathymetry. This fill-in does not seem to be documented so it is not clear what version of GEBCO was used for that.
The plots in the topic clearly show that current SRTM water data do not match the current GEBCO water data at spatial resolution of 15 arc seconds.
If you have a look at the “sources” you can see how different are both approaches. According to GEBCO (The GEBCO_2025 Grid | GEBCO):
The grid uses as a ‘base’ Version 2.7 of the SRTM15+ data set [Tozer et al 2019] largely between latitudes of 50° South and 60° North. This data set is a fusion of land topography with measured and estimated seafloor topography.
The SRTM15+ base grid has been augmented with the gridded bathymetric data sets developed by the four Seabed 2030 Regional Centers to produce the GEBCO_2025 Grid.
SRTM15+V2.0 is constrained using a database of shipboard soundings that sample 10.84% of the ocean floor at 15-arc sec resolution (equal to 18.29% when sampled at 30 arc sec). This database has been compiled and maintained at Scripps Institution of Oceanography (SIO) over the past 20 years and consists of ∼351 million unique sounding records (when median filtered at 15 arc sec) sourced from a variety of institutions.
So, although some of the data for the seafloor is shared between both datasets the grids are not the same.
Sometimes a bit of research is enough to solve some doubts.