Star map for location of astroimages

ID-2022-02_VdB_69_Angel_Nebula.pdf (299.5 KB)

I make images of astronomical objects and want to show the image location on a local star chart. The process is semi-automatic, and passes via a spreadsheet.

First I generate an astrometric solution to the image in my processing software, PixInsight (it does this by matching the image to star catalogues). The solution appears in PixInsight’s console as the coordinates of the centre and the four corners, in Right Ascension and Declination. The posiiton angle of the image is also given as a separate entry.

Astronomical coordinates are like geographical ones except that the longitude equivalent is measured in hours, minutes and seconds, and runs in the opposite direction to longitude.

In the spreadsheet all the items needing manual entry are coloured red (to make it easier not to miss one!)

I cut&paste the astrometric solution block to the spreadsheet, and convert the text to numerical entries (Text to Columns function).

The position angle is inserted too, along with the name of the object and my own image identifier.

Finally comes a bit of experimentation: the margin around the image in terms of degrees, in the bottom left and top right corners. This usually needs adjustment to show a good framing with respect to recognisable objects.

To generate the PDF, the script listed in the spreadsheet is copied and pasted directly into the teminal window (assuming the current directory is the one where the various external files are located).

Finally I do a bit of postprocessing of the PDF in Illustrator, mostly to ensure the Bayer letter (the Greek ones) are not hidden by the black circles reprsenting the magnitudes of the brighter stars, and so that the positions of any star names are optimised.

The external files are:

_Constellation_Boundaries.csv

which provides boundary lines between the constellations

_ST_Constellations_Test.csv

which provides the lines of stick figures representing the constellations; this variant developed by Sky and Telescope magazine

_Constellation_Names.csv

places the constellaation name near the centre of each constllation. These sometimes have to be adjusted in post-processing

_Stars_LE6_5_magnitudes.csv

the location and magnitude of all stars with a magnitude less than 6.5 (brighter stars have a smaller numerical value of magnitude). The file includes the inverse of the RA in degrees, as well as a calculated size for the symbol as a function of magnitude

_Stars_LE6_5_Names.csv

the names of all named stars brighter than 6.5 magnitude, at positions slightly offset from the star position

_Stars_LE6_5_AllBayer.csv

The Bayer (Greek) letters for indentified stars

Finally there are some legend and logo files.

I can’t upload the spreadsheet file (non-allowed extension) so here is a DropBox link: Dropbox - ID-2022-02 MakeImageLocationFile.xlsx - Simplify your life

The example in the image is the postprocessed one, by the way.

cheers,
Richard
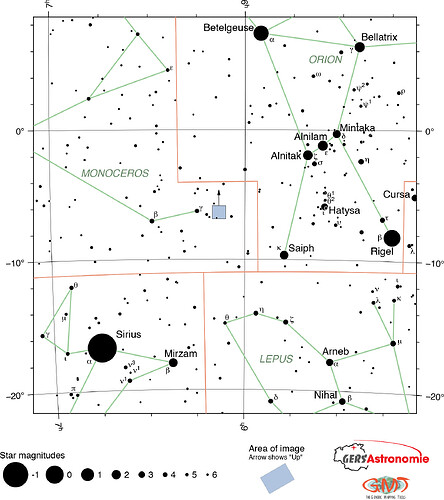
6 Likes

That’s interesting ! I’d be curious to see what the script roughly looks like :slight_smile:

Check the spreadsheet in the DropBox link

Thanks for sharing! Supercool!

This particular example ends up with this script:

gmt begin ID-2022-02
gmt set FONT_ANNOT_PRIMARY 8p,Helvetica MAP_ANNOT_OFFSET_PRIMARY 3p
gmt set MAP_ANNOT_OBLIQUE separate,tick_extend,lon_horizontal,lat_horizontal MAP_FRAME_PEN thin,black
gmt figure ID-2022-02_VdB_69_Angel_Nebula pdf A+m0.5c
gmt basemap -JS-92/-6.4/12c  -R-107/-21.4/-77/8.6+r  -Bxc_RA_intfile_15m.txt -Bya10f2g10
gmt plot _Constellation_Boundaries.csv -W0.75p,darkSalmon
gmt plot _ST_Constellations_Test.csv -W1p,darkSeaGreen3
gmt text _Constellation_Names.csv -F+f9p,Helvetica-Oblique,darkSeaGreen4+jCC
gmt plot -L -W0.25p -SV5p+ea+gblack << EOF
-92.02 -6.37 -0.3 20p
EOF
gmt plot -L -W0.25p -GlightSteelBlue << EOF
-92.539  -5.856
-91.5  -5.86
-91.504  -6.882
-92.545  -6.878
EOF
gmt plot _Stars_LE6_5_magnitudes.csv -i0,1,4 -Scp -Gblack -Wwhite
gmt text _Stars_LE6_5_Names.csv -F+f9p,Helvetica,black+jBR -D-3p/4p
gmt text _Stars_LE6_5_AllBayer.csv -F+f7p,Helvetica,black+jCL -D2p/0p
gmt legend _Legend.txt -Dx0.1c/0.1c+w7c/2c+jBL+o-1.3c/-2.8c
gmt legend _LegendImage.txt -Dx0.1c/0.1c+w2c/2c+jBL+o6.5c/-2.9c
gmt legend _LegendLogo.txt -Dx0.1c/0.1c+w2c/1.5c+jBL+o9.8c/-2.0c
gmt logo -Dx0.1c/0.1c+w1.5c/0.75c+jBL+o10.2c/-2.8c
gmt end show
1 Like

Great work! Where are the data available that you used for this plot?

I’ll put them up on our website. I’ve asked our webmaster to make a page for it.

Fabulous! It will be useful to be able to replicate the plot.

The files and instructions are here:

1 Like

Thanks for the files. Seems to be missing a txt file at:
gmt basemap -JS-92/-6.4/12c -R-107/-21.4/-77/8.6+r -Bxc_RA_intfile_15m.txt -Bya10f2g10

Converting the script to windows .bat format

cheers

Ah yes, I forgot that one as it’s sort of buried in that command.

It’s the file for providing RA coordinates instead of longitude, with 15 min (RA) resolution.

It should be there now.

When you say converting the script to another format, you mean the output of the Excel file I guess. There’s quite a lot of calculations going on in the Excel file and you wouldn’t want to convert that.

Cannot see the file link?

It’s added to the zip. So you’ll have to download it all again, sorry! (they’re not big files though)

The link to download the data files is not working on the page (https://www.gersastronomie.com/astrometry), only the instructions is working there.

Looks like the hyperlink is not active on it.

Thanks for sorting the update (hopefully can re download)

Very nice work, Richard. About 15 years ago, I created a local-hosted star mapping script, using GMT. I haven’t done anything with it in six years! It would likely need some re-vamping as I’m sure there are legacy command option specifications that are now obsolete in GMT6.

I drew from a wide variety of astronomical object catalogs, including UCAC4, URAT1 and the IGSL3 (Gaia) catalogs for background stars. It was a fun GMT project, but I never generalized it for portability; it’s very specific to my installation, as some of the catalogs are pretty hefty. However, I found it helpful for identifying dim objects in my amateur photographic experiments. Sometimes better than could be determined with SkySafari Pro.

Your task to plot photo boundaries is a perfect application of a GMT-based astro system. Thanks for sharing.

These days the AnnotateImage process in PixInsight does the object plotting to whatever level you like and with huge numbers of catalogues. It doesn’t detect all the faint objects, but goes by the astrometric solution based on the stars which can be detected.

In my case though I wanted to provide location maps for my images, so I restricted the stars to visible ones (magnitude less than 6.5).

It’s fixed now!

Can you confirm it’s working now?

Cheers,
Richard

Yes. All is working fine thanks.