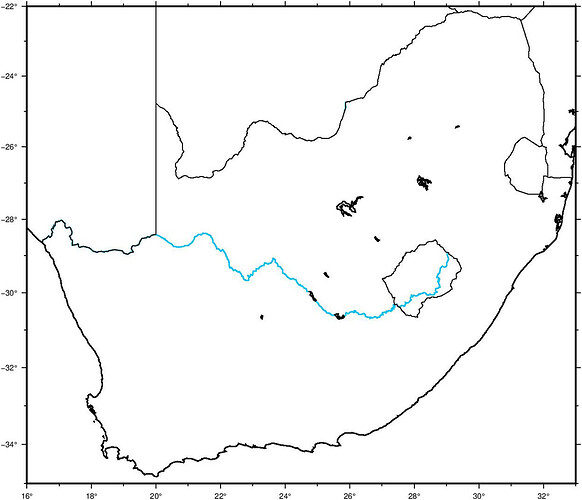
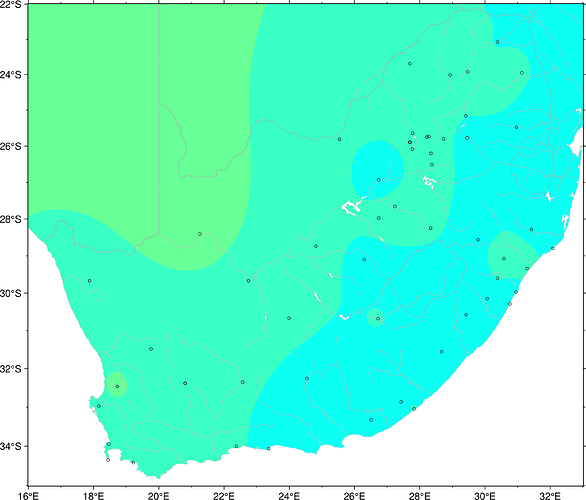
Hello all, please I am still on surface map plot. I have gone through the Tutorial then try the plot still not working can someone please help me out
below is the code and the data and have this plot the map flame without the plotting the coordinates and amplitudes. Glad if I can be help out. using GMT 6.1.1
#!/bin/bash

  gmt begin South_Africa pdf

     gmt set MAP_FRAME_TYPE plain
     gmt set FONT_LABEL 16p
     gmt makecpt -Cjet -T-15/30/2
gmt pscoast -R16/33/-35/-22 -JM20c -BWSne -Baf -I1/1p,0/200/251 -W1,black -Gwhite -Di -N2/0.25p,black -Na/0.5,black  -Swhite > SA.ps
gmt surface pamp.dat -Gsurface.GRD -T0.5 -I0.01 >> t.ps
   gmt grdimage surface.GRD -Q -JM20c -Cg.cpt  >> t.ps
   gmt plot pamp.dat -R16/33/-35/-22 -JM20c  -Ir/grey -Wlightgrey -Swhite -N1/darkgrey >> t.ps
#Lat      long  amplitude
20.81	-32.38	3.462601451
23.99	-30.67	3.47238561
27.71	-25.89	2.983290468
19.22	-34.42	3.370191352
27.69	-25.89	2.809467594
25.54	-25.81	3.047883036
28.22	-25.75	3.370601204
28.22	-25.75	3.491404931
32.08	-28.8	2.386482489
17.88	-29.67	3.347240755
20.81	-32.38	3.018843543
30.38	-23.08	2.779844546
31.42	-28.29	2.419745172
28.67	-31.55	1.835212073
37.86	-46.88	10.3258571
28.22	-25.75	3.626294693
28.22	-25.75	3.588034193
26.72	-30.68	3.450797176
26.3	-29.1	1.810321089
27.43	-32.86	1.801976579
27.78	-25.64	3.479390519
28.73	-25.8	3.277078322
18.45	-34.35	2.622937276
26.51	-33.32	2.545416159
24.54	-32.25	2.302805262
28.37	-26.51	3.308374094
27.69	-25.89	2.069509857
30.07	-30.15	0.466945394
24.81	-28.74	3.915630899
29.42	-30.57	1.299706356
27.77	-26.08	3.266030423
27.24	-27.66	3.85353708
18.73	-32.46	6.780467738
29.45	-25.77	2.199781941
39.99	-29.21	3.071521361
30.96	-25.48	2.896929353
28.33	-28.25	3.522047204
26.74	-26.93	1.46070852
23.37	-34.06	1.786851179
28.93	-24.01	3.291937952
28.28	-25.73	4.369096225
22.75	-29.67	3.76435148
29.47	-23.92	4.714191319
30.76	-30.29	2.10941761
17.88	-29.67	3.974042045
31.29	-29.34	4.746402624
20.81	-32.38	2.731779255
26.74	-27.98	3.802077695
19.45	33.65	4.360541202
28.34	-26.2	3.261933725
28.33	-28.25	2.492962693
19.76	-31.48	3.450588564
18.47	-33.95	4.163197896
30.95	-29.97	1.505421449
27.83	-33.04	3.704138425
27.7	-23.69	3.394110991
29.41	-25.16	2.970443754
22.38	-34	3.746083503
30.58	-29.07	4.720041485
18.16	-32.97	3.7565446
29.78	-28.56	2.248874066
31.13	-23.95	3.142481019
25.61	33.99	4.184718732
22.57	-32.35	3.293254127
21.26	-28.41	7.080971271
30.38	-29.6	3.505024481

