Thematic mapping of land cover by pygmt

Hello everyone

I want to use pygmt to draw a thematic map of land cover, I defined my own cpt file, but the result of the map has no color, my code is as follows:

import pygmt

fig = pygmt.Figure()

pygmt.makecpt(cmap="classcolor.cpt", series=[1, 8, 1], color_model="+cCropland,Forest,Shrub,Grassland,Water,Sonw/Ice,Barren,Impervious")

fig.grdimage(grid='LC2013.tif', cmap=True)

fig.colorbar(cmap=True, equalsize=0.5)

fig.show()

The customized cpt file is as follows:
1 250/227/156 ;Cropland
2 68/111/51 ;forest
3 51/160/44 ;Shrub
4 171/211/123 ;Grassland
5 30/105/180 ;Water
6 166/206/227 ;Sonw/Ice
7 207/189/163 ;Barren
8 226/66/144 ;Impervious

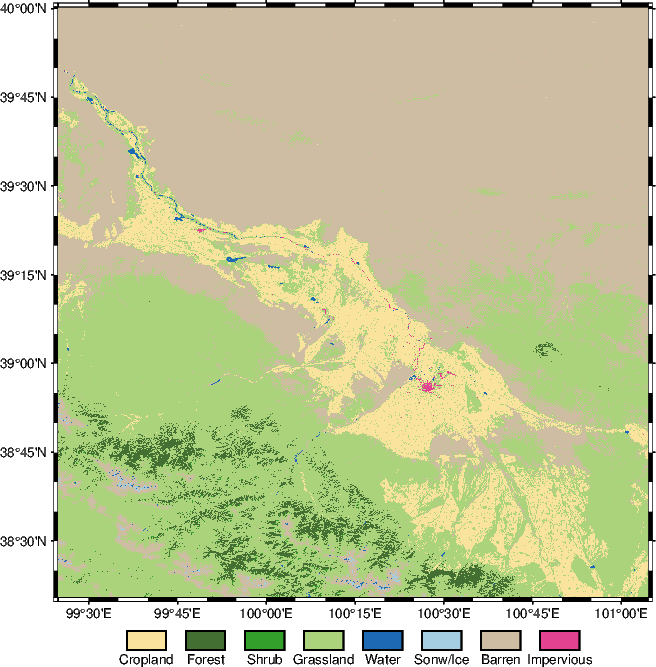
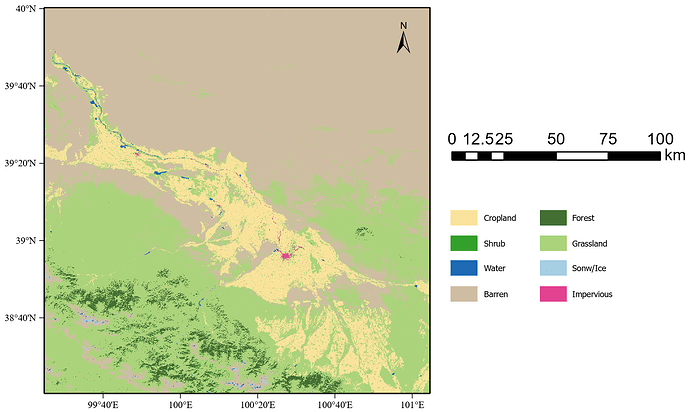
The final result I’d like to get is similar to the diagram below, with a compass, scale, and legend.

The data and cpt files used are shown in the link below:

Hello @wensentry,

thanks for granting access to the material!

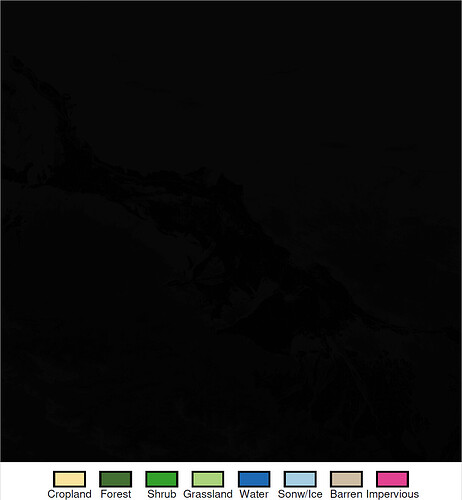
Hm, I am not sure whether the provided tif file is correct. When I open it externally, it appears completely black. Is this expected? Unfortunately, I have only little experience working with tif files.

Hello @yvonnefroehlich,

Thank you for responding.

This tif raster data is correct in that its image pixel values are integers from 1 to 8, with each number representing a feature type, e.g., water body, vegetation, etc.

Maybe the Gallery example RGB image can help you? I tried to adjust it for your tif file, but so far the plot is still completely black. If I find the time later the day or in the next days, I will look at this again. Hopefully someone else can help here.

Here is the solution: If the values used for the color-coding are converted from integer to float type (astype(float)), it is possible to plot this tif file after loading it as xarray.DataArray. Otherwise, the plot is completely black, which indicates that the colors are not correctly assigned to the data values. I feel this looks like a bug in PyGMT or GMT.

import pygmt
import rioxarray

# Load tif file
with rioxarray.open_rasterio(filename="LC2013.tif") as img:
    image = img.rio.clip_box(minx=99.5, maxx=101.1, miny=38.4, maxy=40)
    image = img.load()

# Convert data values used for color-coding from integer to float type
image.data = image.data.astype(float) 

# Create geographic map
fig = pygmt.Figure()

pygmt.makecpt(
    cmap="classcolor.cpt",
    series=[1, 8, 1],
    color_model="+cCropland,Forest,Shrub,Grassland,Water,Sonw/Ice,Barren,Impervious",
)

fig.grdimage(
    image,
    cmap=True,
    frame=True,
)

fig.colorbar(cmap=True, equalsize=0.5)

fig.show()
# fig.savefig(fname="tif_cpt.png", dpi=100)

Output figure

1 Like

No bug, see this Julia warning

julia> viz("LC2013.tif", C="classcolor.cpt")
┌ Warning: You are possibly asking to assign a CPT to an image. That is not allowed by GMT. See function image_cpt!

Almost for sure what you did with the data type conversion was to convert the image into a grid

It’s perfect. Thank you very much. I’ve been puzzling over this for ages. @yvonnefroehlich

Thank you! @Joaquim

Thanks for trying this in Julia @Joaquim!
Hm, seems like I have to look at this in more detail. At least it’s working now.

However, the Gallery example RGB Image — PyGMT works without any conversion. There the tif file is loaded via rioxarray.open_rasterio into a xarray.DataArray. This is what I did analoagous for the “LC2013.tif” file:

import pygmt
import rioxarray

# Load tif file
with rioxarray.open_rasterio(filename="LC2013.tif") as img:
    image = img.rio.clip_box(minx=99.5, maxx=101.1, miny=38.4, maxy=40)
    image = img.load()

I think after this step it’s no longer a picture:

image
Out[1]: 
<xarray.DataArray (band: 1, y: 4530, x: 4530)>
array([[[0, 0, 0, ..., 0, 0, 0],
        [0, 7, 7, ..., 7, 7, 7],
        [0, 7, 7, ..., 7, 7, 7],
        ...,
        [0, 4, 4, ..., 4, 4, 4],
        [0, 4, 4, ..., 4, 4, 4],
        [0, 4, 4, ..., 4, 4, 4]]])
Coordinates:
  * band         (band) int32 1
  * x            (x) float64 99.41 99.41 99.41 99.41 ... 101.1 101.1 101.1 101.1
  * y            (y) float64 40.0 40.0 40.0 40.0 ... 38.34 38.34 38.34 38.34
    spatial_ref  int32 0
Attributes:
    AREA_OR_POINT:        Area
    TIFFTAG_XRESOLUTION:  1
    TIFFTAG_YRESOLUTION:  1
    _FillValue:           0
    scale_factor:         1.0
    add_offset:           0.0

Interestenting not only image.data = image.data.astype("float") but also image.data = image.data.astype("int") lead to a correct color-coding.

image.data
Out[2]: 
array([[[0, 0, 0, ..., 0, 0, 0],
        [0, 7, 7, ..., 7, 7, 7],
        [0, 7, 7, ..., 7, 7, 7],
        ...,
        [0, 4, 4, ..., 4, 4, 4],
        [0, 4, 4, ..., 4, 4, 4],
        [0, 4, 4, ..., 4, 4, 4]]], dtype=uint8)
image.data = image.data.astype("float") 
image.data
Out[3]: 
array([[[0., 0., 0., ..., 0., 0., 0.],
        [0., 7., 7., ..., 7., 7., 7.],
        [0., 7., 7., ..., 7., 7., 7.],
        ...,
        [0., 4., 4., ..., 4., 4., 4.],
        [0., 4., 4., ..., 4., 4., 4.],
        [0., 4., 4., ..., 4., 4., 4.]]])
image.data = image.data.astype("int")
image.data
Out[4]: 
array([[[0, 0, 0, ..., 0, 0, 0],
        [0, 7, 7, ..., 7, 7, 7],
        [0, 7, 7, ..., 7, 7, 7],
        ...,
        [0, 4, 4, ..., 4, 4, 4],
        [0, 4, 4, ..., 4, 4, 4],
        [0, 4, 4, ..., 4, 4, 4]]])
Yvonne, sorry but this is quickly moving into unknown land for me. For example I see that the xarray is saying that bands data type is int32 (4 bytes) instead of uint8 (1 byte). What happens after in GMT I don’t recall. int32 seems a really useless type for either grids or images.

Also, that LC2013.tif file has probably an error. It starts a 0 and goes to 8, which makes it having 9 classes instead of the 8 in the CPT. Fortunately, once it became a grid those zeros were painted as bg color so the rest of the image looked correct, but that is not what I see in GMT.jl where the image remains as a image when transmitted to GMT. Again here the unknown land for me is that I have no idea what PyGMT does for transmitting an image to GMT. GMTmex and GMT.jl transmit native GMT image objects (structures) but PyGMT has chosen a different path so I don’t know how things work.

What I did in GMT.jl is was to write that image_cpt!function that adds a colormap to the image object and GMT can read it. It can not assign it itself (that’s what the julia warning informs) but can read it if that info is already there. In fact, it expects it to be in the Image structure.

No worries @Joaquim :slight_smile:. Thanks for your explanations. But I think I have to move this issue to the weekend, as this seems to be more complicated than initially thought. But maybe someone else has time to look into this issue in more detail in the meantime to figure out whether this is a general problem or somehow related to this tif file.

I think there is a significant difference between the tif file in the Gallery example and the tif file in this forum post that is causing the issue:
The tif file in the Gallery example directly contains RGB color codes (band: 3). However, in this post, the tif file contains values of a quantity with no relation to any color information (band: 1). So it’s actually not a real picture so far. This probably also explains why this tif file is displayed completely in black when opening it externally. To make it a colorful picture, one has to define a colormap that assigns color information to the quantity values. This is similar to the third paragraph of @Joaquim’s comment regarding the need of defining / adding a colormap. It seems that uint8 is not an accepted / considered data type at this step, but int and float are fine. I am not sure why this is and whether this is expected or should / can be considered as a bug.

Well, no. It’s a real image, just not RGB. It is of what is called an indexed image where the image values are actually a lookup to a colormap. When the image has no colormap, we create a default one from [0,255] but because this image’s maximum is 8 we have shades on the interval [0,8], which is nearly black.

Why does this happen even if a suitable colomap is specified:

gmt makecpt -Cgray -T0/8/1 -N > test.cpt
gmt grdimage LC2013.tif -Ctest.cpt -png quick

The result is the same as you wrote (shades on the interval [0,8] from [0,255], which is nearly black).

Below is the output from gdalinfo LC2013.tif -mm and gmt grdinfo LC2013.tif

$ gdalinfo LC2013.tif -mm
Driver: GTiff/GeoTIFF
Files: LC2013.tif
Size is 4530, 4530
Coordinate System is:
GEOGCRS["WGS 84",
    ENSEMBLE["World Geodetic System 1984 ensemble",
        MEMBER["World Geodetic System 1984 (Transit)"],
        MEMBER["World Geodetic System 1984 (G730)"],
        MEMBER["World Geodetic System 1984 (G873)"],
        MEMBER["World Geodetic System 1984 (G1150)"],
        MEMBER["World Geodetic System 1984 (G1674)"],
        MEMBER["World Geodetic System 1984 (G1762)"],
        MEMBER["World Geodetic System 1984 (G2139)"],
        ELLIPSOID["WGS 84",6378137,298.257223563,
            LENGTHUNIT["metre",1]],
        ENSEMBLEACCURACY[2.0]],
    PRIMEM["Greenwich",0,
        ANGLEUNIT["degree",0.0174532925199433]],
    CS[ellipsoidal,2],
        AXIS["geodetic latitude (Lat)",north,
            ORDER[1],
            ANGLEUNIT["degree",0.0174532925199433]],
        AXIS["geodetic longitude (Lon)",east,
            ORDER[2],
            ANGLEUNIT["degree",0.0174532925199433]],
    USAGE[
        SCOPE["Horizontal component of 3D system."],
        AREA["World."],
        BBOX[-90,-180,90,180]],
    ID["EPSG",4326]]
Data axis to CRS axis mapping: 2,1
Origin = (99.412473239999997,40.004796440000000)
Pixel Size = (0.000367370400000,-0.000367370400000)
Metadata:
  AREA_OR_POINT=Area
  TIFFTAG_XRESOLUTION=1
  TIFFTAG_YRESOLUTION=1
Image Structure Metadata:
  INTERLEAVE=BAND
Corner Coordinates:
Upper Left  (  99.4124732,  40.0047964) ( 99d24'44.90"E, 40d 0'17.27"N)
Lower Left  (  99.4124732,  38.3406085) ( 99d24'44.90"E, 38d20'26.19"N)
Upper Right ( 101.0766612,  40.0047964) (101d 4'35.98"E, 40d 0'17.27"N)
Lower Right ( 101.0766612,  38.3406085) (101d 4'35.98"E, 38d20'26.19"N)
Center      ( 100.2445672,  39.1727025) (100d14'40.44"E, 39d10'21.73"N)
Band 1 Block=4530x1 Type=Byte, ColorInterp=Gray
    Computed Min/Max=1.000,8.000
  NoData Value=0
gmt grdinfo LC2013.tif
LC2013.tif: Title: Grid imported via GDAL
LC2013.tif: Command: 
LC2013.tif: Remark: 
LC2013.tif: Pixel node registration used [Geographic grid]
LC2013.tif: Grid file format: gd = Import/export through GDAL
LC2013.tif: x_min: 99.41247324 x_max: 101.076661152 x_inc: 0.0003673704 name: x n_columns: 4530
LC2013.tif: y_min: 38.340608528 y_max: 40.00479644 y_inc: 0.0003673704 name: y n_rows: 4530
LC2013.tif: v_min: 1.79769313486e+308 v_max: -1.79769313486e+308 name: z
LC2013.tif: scale_factor: 1 add_offset: 0
LC2013.tif: Default CPT: 
+proj=longlat +datum=WGS84 +no_defs

So it’s actually not a real picture so far.

Well, no. It’s a real image, just not RGB. It is of what is called an indexed image where the image values are actually a lookup to a colormap. When the image has no colormap, we create a default one from [0,255] but because this image’s maximum is 8 we have shades on the interval [0,8], which is nearly black.

This was probably not optimally formulated. With the term “no real picture” I only wanted to underline that the provided tif file does not contain any color information or colormap.


Why does this happen even if a suitable colomap is specified:

If I understood @Joaquim correctly, it is not allowed or possible to assign a CPT to an image in GMT, but it is possible with the Julia wrapper (see the function image_cpt). In PyGMT it seems possible to circumvent this limitation by converting the xarrray.DataArray.data via astype() from uint8 to int or float. Then the user-defined GMT colormap is considered.

That is correct Yvonne. I’m not foreseeing right now any possible bad consequence other than multiplying the memory footprint by 5, but it should be kept in mind that what is being passed to GMT is a grid, not an image.

Ok but then i am struggling to understand the definition of “image”.

Cause if I transform the original LC2013.tif into Uint16, gmt grdimage suddenly has no problem assigning a palette (turbo by default):

gdal_translate -ot UInt16 LC2013.tif LC2013-2.tif
gmt grdimage LC2013-2.tif -png quick

the only difference beween LC2013.tif and LC2013-2.tif appears that data type reported by gdalinfo for the latter is Int16 (not “Byte”).

In GMT, a ‘grid’ is a raster with 1 band, whereas an ‘image’ is a raster with multiple bands. Note that GMT’s grdimage can only plot multi-band images with 3-bands (RGB), or a 1-band grid. A 3-band image would already have colour and would not need a colormap, whereas a 1-band grid needs a colormap.

Looking at the output of gmt grdinfo on your LC2013.tif file above, it seems like GMT is reporting an incorrect z range from 1.79769313486e+308 to -1.79769313486e+308. I tried to force selecting another non-existent band using +b1 (second band) following gmt — GMT 6.4.0 documentation

gmt grdinfo LC2013.tif+b1
ERROR 5: LC2013.tif: GDALDataset::GetRasterBand(2) - Illegal band #
ERROR 10: Pointer 'hBand' is NULL in 'GDALGetRasterColorInterpretation'.
ERROR 10: Pointer 'hBand' is NULL in 'GDALGetRasterNoDataValue'.
ERROR 10: Pointer 'hBand' is NULL in 'GDALGetRasterColorInterpretation'.
ERROR 10: Pointer 'hObject' is NULL in 'GDALGetMetadataItem'.
ERROR 10: Pointer 'hBand' is NULL in 'GDALGetRasterDataType'.

LC2013.tif: Title: Grid imported via GDAL
LC2013.tif: Command: 
LC2013.tif: Remark: 
LC2013.tif: Pixel node registration used [Geographic grid]
LC2013.tif: Grid file format: gd = Import/export through GDAL
LC2013.tif: x_min: 99.41247324 x_max: 101.076661152 x_inc: 0.0003673704 name: x n_columns: 4530
LC2013.tif: y_min: 38.340608528 y_max: 40.00479644 y_inc: 0.0003673704 name: y n_rows: 4530
LC2013.tif: v_min: 1 v_max: 8 name: z
LC2013.tif: scale_factor: 1 add_offset: 0
LC2013.tif: Default CPT: 
+proj=longlat +datum=WGS84 +no_defs

Notice how the scale_factor now goes from 1 to 8, instead of 1.79769313486e+308 to -1.79769313486e+308 before. However, this obviously won’t work, since there are errors accessing a non-existent 2nd band from the LC2013.tif file.

@wensentry, is this file sourced from somewhere else, or did you create it yourself? If you made it yourself, could you show us how it was created perhaps? There seems to be something strange in the way that TIF file was generated, and maybe there’s some setting we can tweak to make it output differently.

Yeah, it’s strange that uint16 and int16 works for this grdimage plot, but not Byte (uint8). I’m wondering if there’s a limitation on GMT’s side on plotting categorical images from GeoTIFFs of Byte type, but can’t see anything mentioned at these links:

The only other difference I see when doing verbose="d" (-Vd) is that the Byte grid returns this (truncated to relevant part):

grdimage [INFORMATION]: Evaluate image pixel colors
grdimage [INFORMATION]: Plotting 8-bit grayshade image

whereas the Uint16 image returns this:

grdimage [INFORMATION]: Evaluate image pixel colors
grdimage [INFORMATION]: Basic z(x,y) -> color image with no illumination.
grdimage [INFORMATION]: Plotting 24-bit color image
PSL: Colormap of 9 colors created
PSL: Image depth reduced to 4 bits

LC2013.tif can be converted to LC2013.nc (netcdf) using gdal_translate (preserving data type) or gmt grdconvert (converts data to float32 by default) and back to LC2013-1.tif again (with data type unit8, gdal_translate -ot byte). The .nc file is plotted just fine by gmt grdimage using a palette, both with uint8 data and float32. .tif file with uint8 data seem always plotted with these 8 darkest shades out of 255.

Seems to me we only need to make a few changes in grdimage to allow an image with no colormap use a CPT and pick colours from it depending on the byte values. Looking at this now. The only case we have is byte image with the bytes being treated as gray (sadly 0-8) but if we pick from CPT instead I think it will work OK. Just need to ensure the output image is 3 layers while input is 1.