Third y axis offset

Hello everyone!

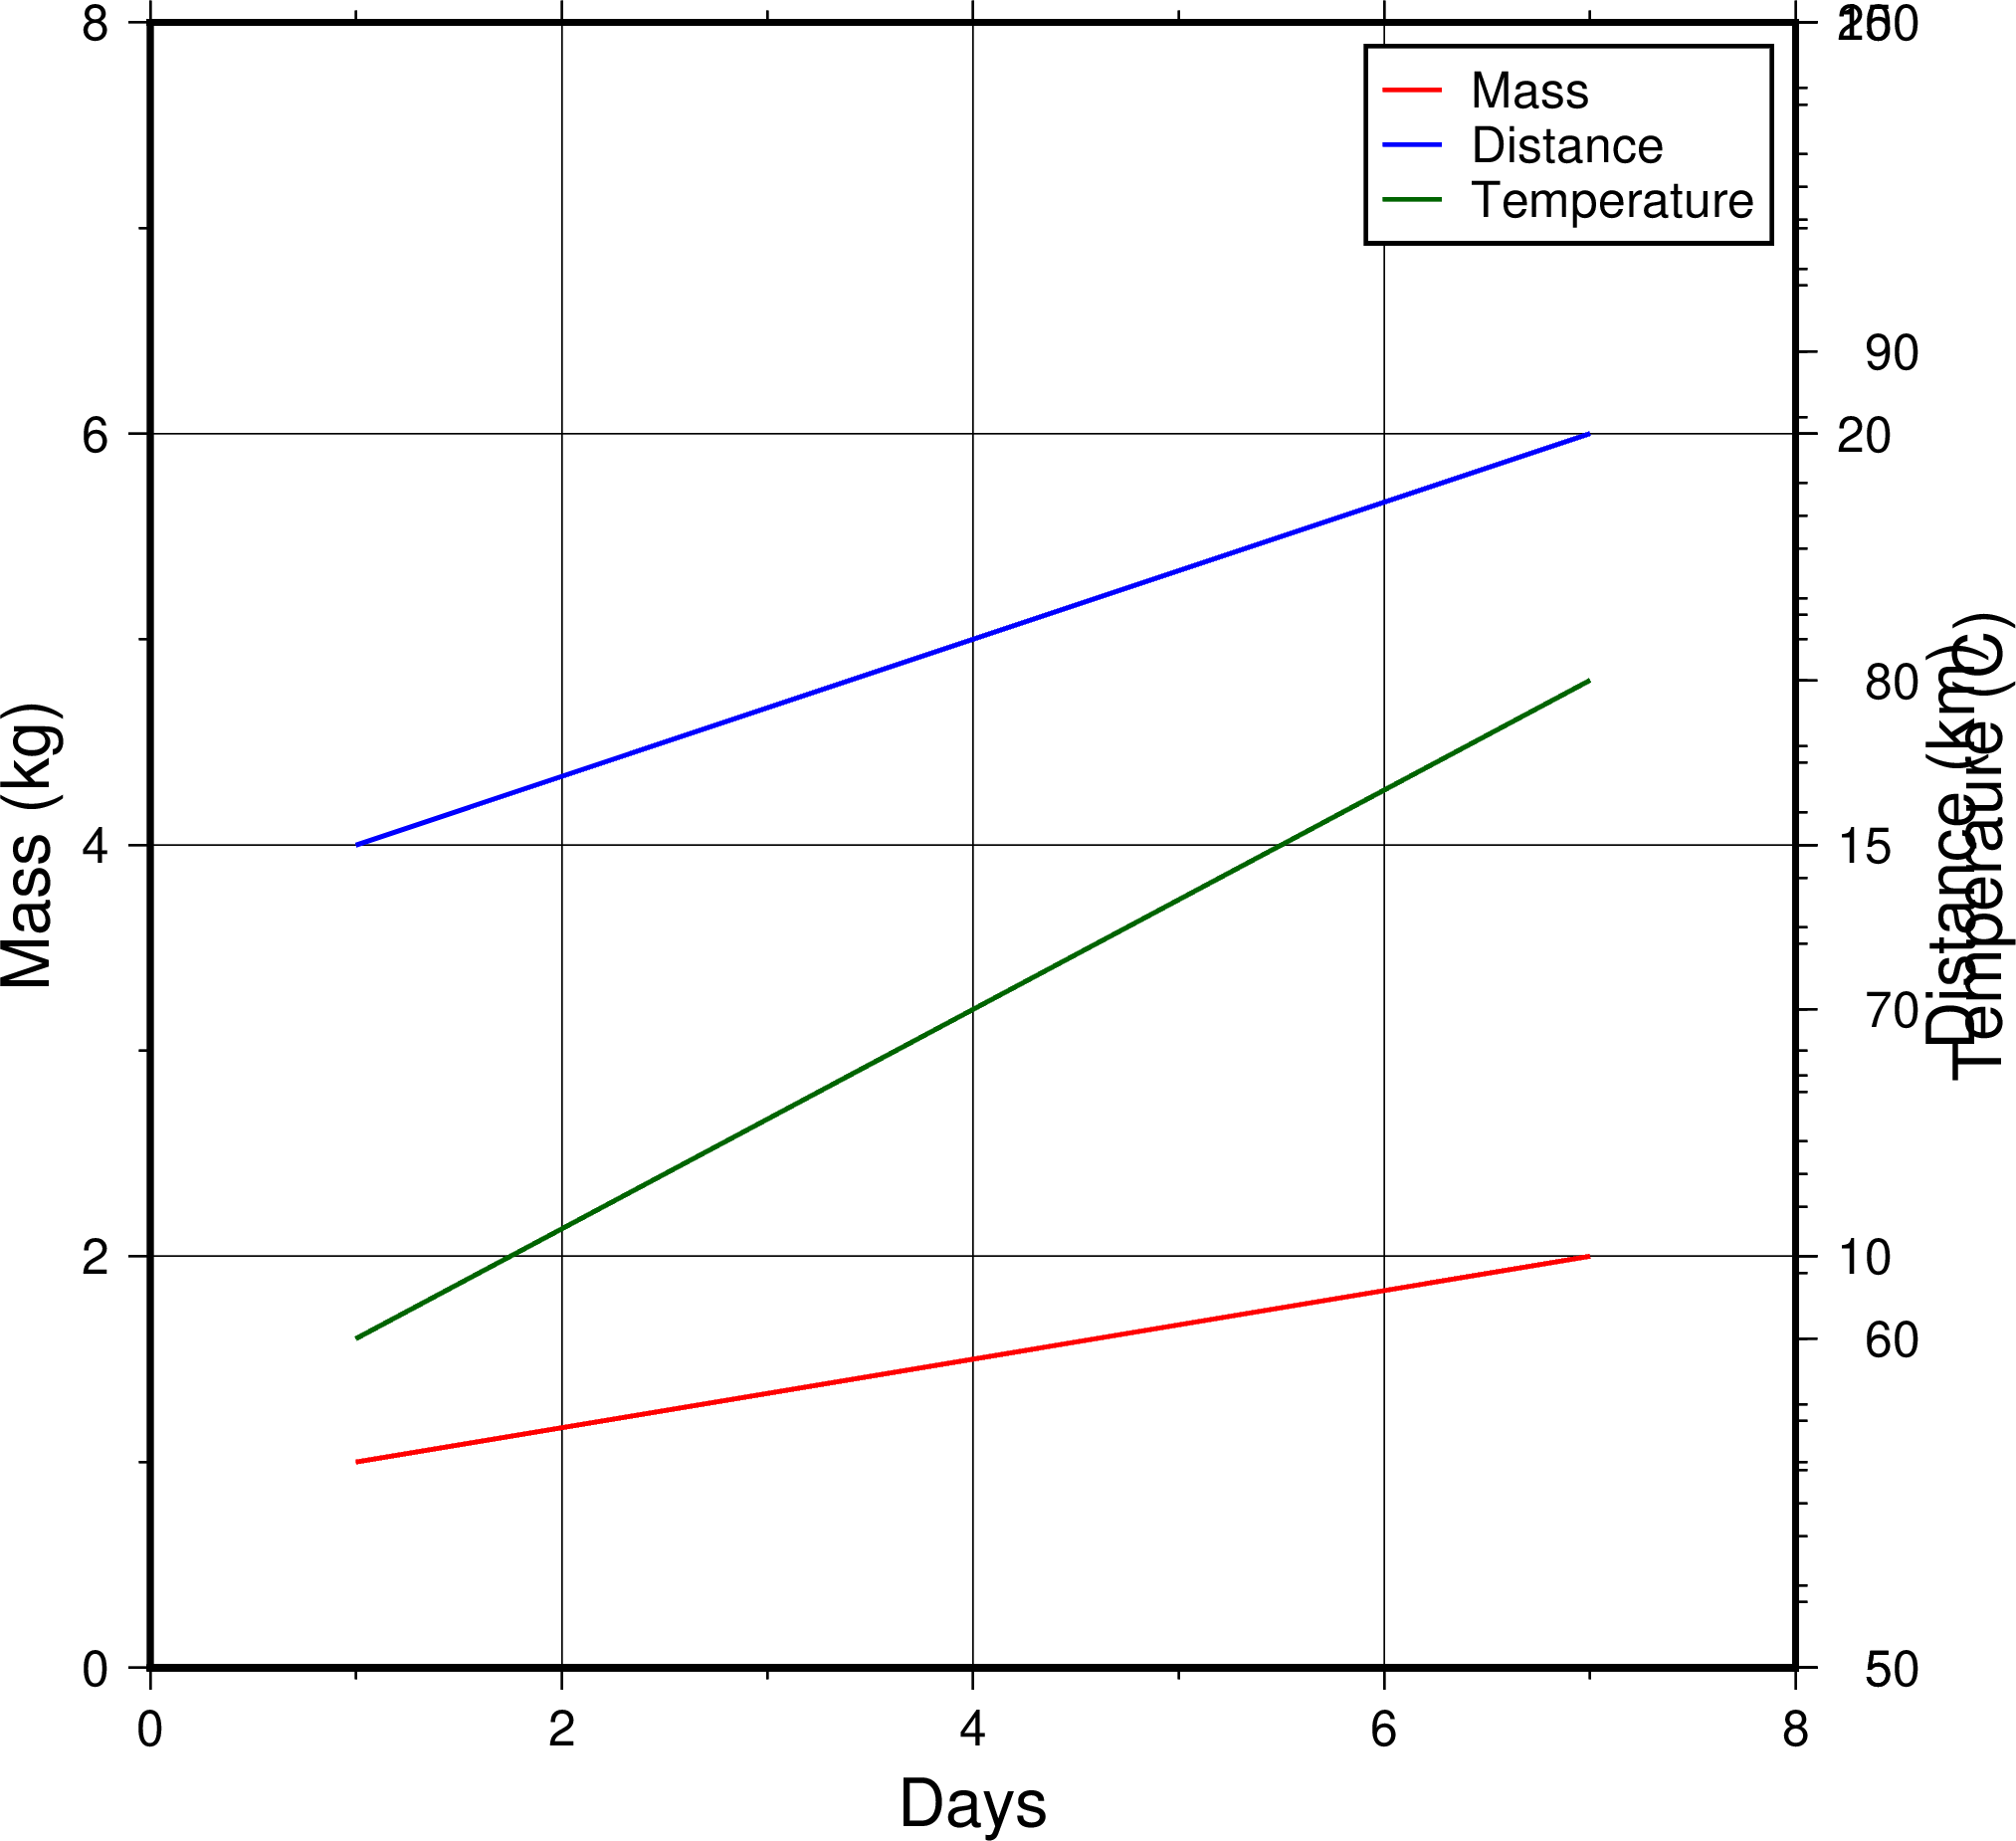
I have three different lines in the same cartesian plot. How can I shift one y-axis in the right-hand side of the plot to avoid overlapping? I tried -Xw-2p option, but it shifted the entire plot.

Thank you for your attention!

Regards,
Anuar

Maybe you can try that ?

gmt — GMT 6.5.0 documentation
[a | f | g ]stride [±phase ][unit ].

That should shift the annotation by “phase”, eg with phase = +5:


original (-Ba10) : 0 10 20 30 ...
shifted (-Ba10+5) : 5 15 25 35 ...

Hi @PlanetGus,

Thank you very much for your response! I am afraid I did not explain my problem clear enough, I apologize for that! All three lines have different units so I need three y axis to represent them. Let me explain though the example.

#!/usr/bin/env bash
gmt begin third_axis
# Mass
echo 1 1 > t1.dat
echo 7 2 >> t1.dat
gmt plot t1.dat -R0/8/0/8 -JX14 -Bafg -BWSen -Bx+l"Days" -By+l"Mass (kg)" -lMass -W1,red
# Distance
echo 1 15 > t2.dat
echo 7 20 >> t2.dat
gmt plot t2.dat -R0/8/5/25 -JX14 -BESen -By+l"Distance (km)" -lDistance -W1,blue
# Temperature
echo 1 60 > t3.dat
echo 7 80 >> t3.dat
gmt plot t3.dat -R0/8/50/100 -JX14 -BESen -By+l"Temperaure (C)" -lTemperature -W1,darkgreen
gmt end show
rm t*dat

I would like the Temperature axis to be shifted slightly right so it does not overlap with the Distance axis.

What about

plot [...1...] -BWeSn
plot [...2...] -BwEsn
plot [...3...]
basemap -X1c

?

just overlay another axis with basemap -X1c and -BE and your different -R same -J

It worked! Truly appreciate your time and help @PlanetGus and @pwessel!