Hey there!
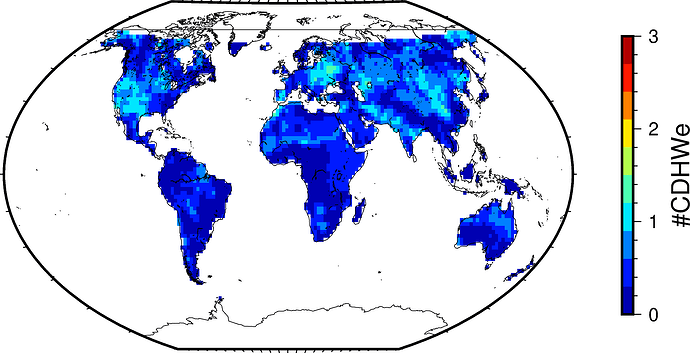
I am new to pygmt. I am using grdimage to create a colormap of a gridded data. I am using the shorelines as true, to show the shorelines. I have used robinson projection, however there is an issue while plotting the data, there is a horizontal line coming everytime. I have attached the figure below.
MY code is as follows:
import pygmt as gmt
fig=gmt.Figure()
# fig.basemap(region=[-180,180,-66,66])
gmt.makecpt(cmap="jet", series=[0, 3, 0.3])
# gmt.makecpt(cmap="jet")
fig.grdimage(grid=data1,projection="R13c",nan_transparent=True,frame="f",no_clip=False)

# fig.colorbar(frame=["a2", "x+lRP", "y+l"])
fig.coast(shorelines=True)

fig.colorbar(position='JMR',
            frame=["x+l#CDHWe"],
            scale=1,
            )
fig.show()
Please suggest me some ideas, how can I overcome this.
Also please suggest how can I drastically improve the quality of my figures.
Thank you.
