Hi all,
I have a an interpolation in the form of a .grd file. These files cover all the the US and Canada up to Yellowknife.
I’m trying create a map that only includes the data from the Pacific Northwest (Washington, Oregon, Idaho) but I’m having some trouble figuring out how to zoom in on the region I want.
There are a few issues, but I think the one I want to focus on first is that the maps I create that only contain Washington (For some reason GMT doesn’t like Idaho or Oregon), is still showing the full extent of the .grd file, when I only want to show Washington. Here is an output of one of the maps:
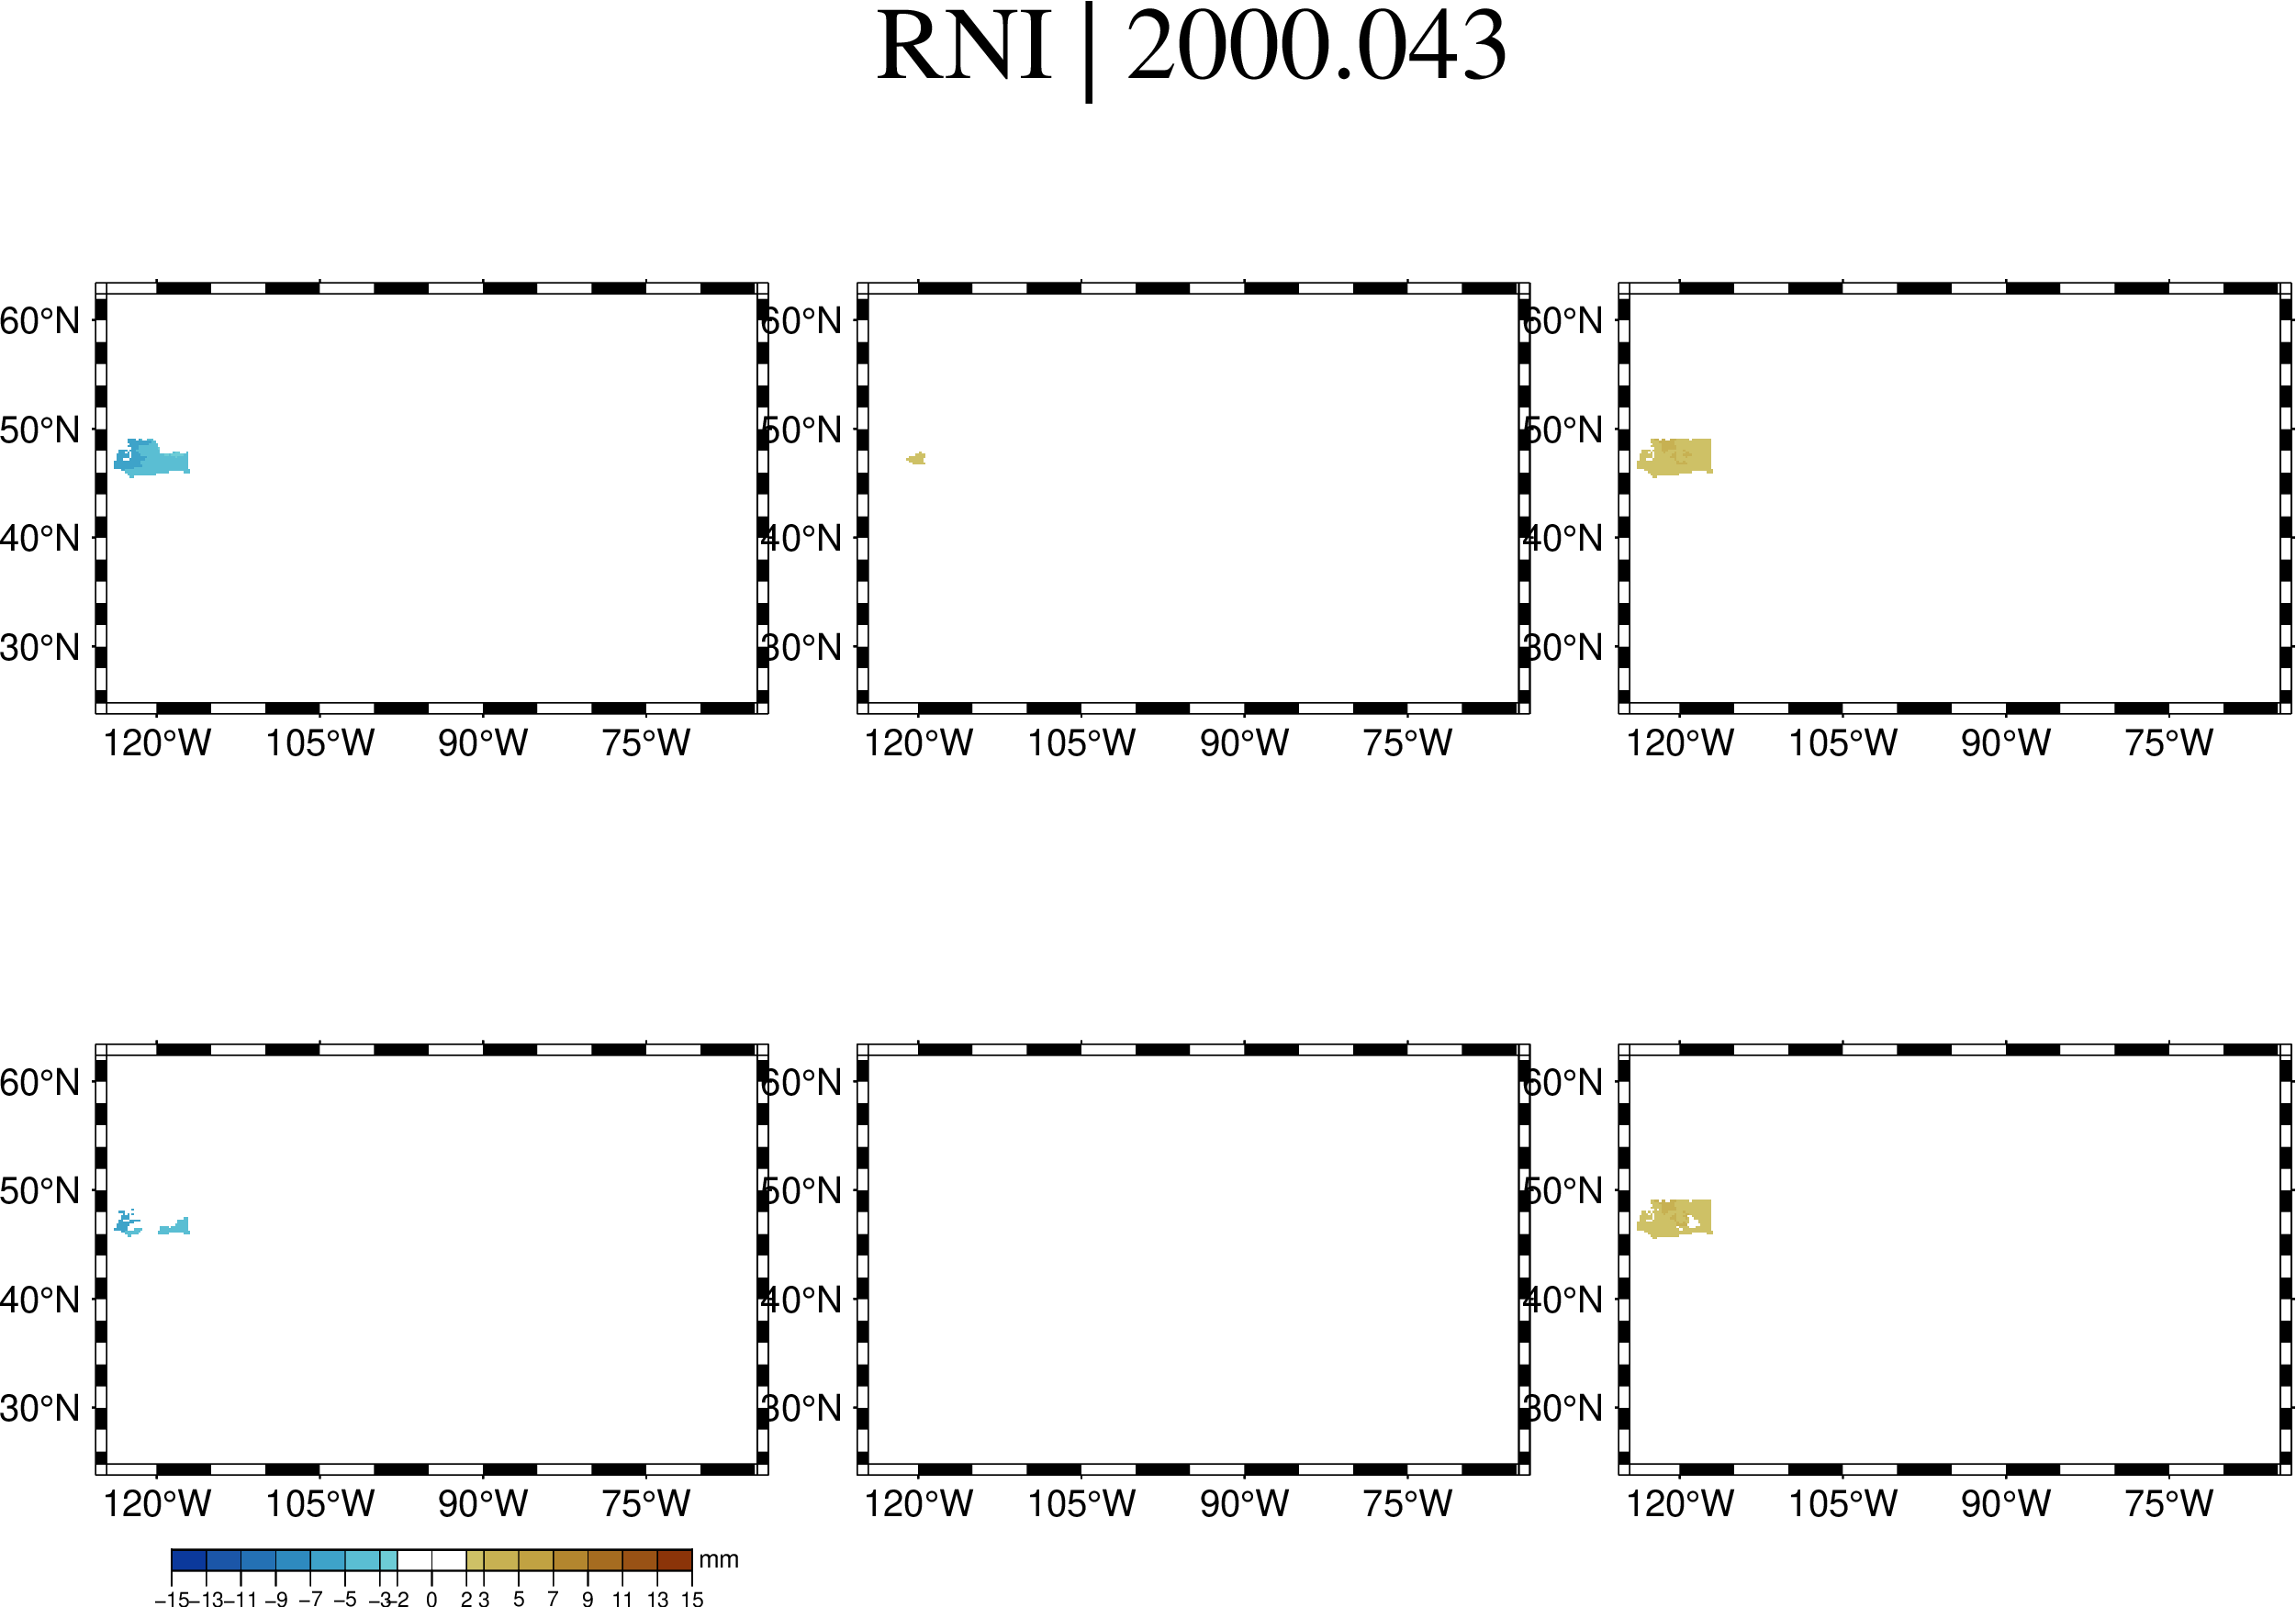
I’ve isolated Washington, and I specified the region to roughly encompass Washingon as well, but I can’t seem to figure out how to zoom in on just Washinton.
Here is what I’m doing currently:
function gmt_readfunc(i)
    sigsigrad = GMT.gmtread(i[1])
    sigrad = GMT.gmtread(i[2])
    sigsiglon = GMT.gmtread(i[3])
    siglon = GMT.gmtread(i[4])
    sigsiglat = GMT.gmtread(i[5])
    siglat = GMT.gmtread(i[6])
    return sigrad, sigsigrad, siglon, sigsiglon, siglat, sigsiglat
end

file_count = 1

for i in zip(twosigrad, sigrad, twosiglon, siglon, twosiglat, siglat)

    sigrad, sigsigrad, siglon, sigsiglon, siglat, sigsiglat = gmt_readfunc(i)

    base = basename(i[1])
    yr = string(base[1:8])

    count_up = lpad(file_count, 4, "0")

    GMT.subplot(grid = "2x3", title = "RNI | $yr", savefig = imgpath * "$count_up" * ".png",);

        # rad
        D1 = GMT.coast(DCW = (name = "US.WA"), dump = true);
        G1 = GMT.grdcut(sigrad, proj=(:Winkel, [-130 -112 46 51]), cutline=(polygon = D1, crop2cuteline= true));
        G2 = GMT.grdcut(sigsigrad, proj=(:Winkel, [-130 -112 46 51]), cutline=(polygon = D1, crop2cuteline= true));

        GMT.grdimage(G1, cmap = roma, panel = (1,1))
        GMT.grdimage(G2, cmap = roma, panel = (2,1))

        # lon
        D2 = GMT.coast(DCW = (name = "US.WA"), dump = true);
        G3 = GMT.grdcut(siglon, proj=(:Winkel, [-130 -112 46 51]), cutline=(polygon = D2, crop2cuteline= true));
        G4 = GMT.grdcut(sigsiglon, proj=(:Winkel, [-130 -112 46 51]), cutline=(polygon = D2, crop2cuteline= true));

        GMT.grdimage(G3, cmap = roma, panel = (1,2))
        GMT.grdimage(G4, cmap = roma, panel = (2,2))

        # lat
        D3 = GMT.coast(DCW = (name = "US.WA"), dump = true);
        G5 = GMT.grdcut(siglat, proj=(:Winkel, [-130 -115 46 51]), cutline=(polygon = D3, crop2cuteline= true));
        G6 = GMT.grdcut(sigsiglat, proj=(:Winkel, [-130 -115 46 51]), cutline=(polygon = D3, crop2cuteline= true));

        GMT.grdimage(G5, cmap = roma, panel = (1,3))
        GMT.grdimage(G6, cmap = roma, panel = (2,3))

        colorbar!(position=(outside=true, anchor=:BC), cmap=roma, ylabel = "mm");

    subplot(:end)
    file_count += 1
end
I think the way I’m approaching the problem makes intuitive sense (at least to me lol), but no matter where I move around the projection and region, it’s never actually read in and in the output image.
Any help or insight is much appreciated! I think once I figure out the “zoom” issue, I can then see why GMT doesn’t like "US.OR" and "US.ID" but will take "US.WA". Or just broadly specify the PNW instead of designating the states in the DCW option.
Thanks in advance ![]()
– Rob