Unable to color polygons based on their attributes

Hi everyone,
I am facing issue while trying to color polygons based on their attributes.
I tried to do this through this method (https://flint.soest.hawaii.edu/t/how-to-color-polygons-of-a-geopandas-dataframe-in-pygmt/1138), but it still not solved.

I am trying to color the polygons based on the column ‘Year_only’ (in shapefile). In case anyone would like to see it: Upload Files | Free File Upload and Transfer Up To 10 GB (here is the shapefile that I used; it a small file).

Here are the codes I used:

fig = pygmt.Figure()
pygmt.makecpt(cmap="vik", series=[2017, 2021, 1], continuous=True, reverse=True)
fig.plot(data=footprint_each_DEMs,
         cmap=True, 
         color="+z", 
         close=True, 
         aspatial="Z=Year",
         pen="thinnest,red,-"
        )
fig.colorbar(position="jMR+jMR+w8c+o0.1c/1c+e")
fig.show()

I followed the same method as in the example (https://flint.soest.hawaii.edu/t/how-to-color-polygons-of-a-geopandas-dataframe-in-pygmt/1138), but It seems not able to get what I expect.

What I got is attached below. The polygons are not colored based on the attributes, though the right colorbar appears.

But I expect something like below, with Years as colorbar.

index

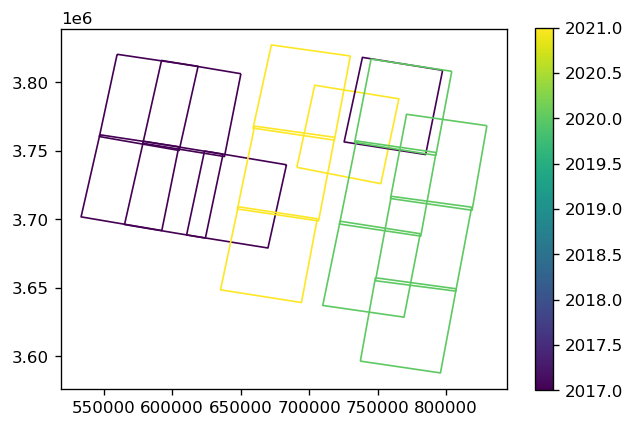
It would be great if anyone can give me some hint to get so.

Thank you.
Arindan

should it not be Year_only then?

Hi Mikhail,
Thanks for seeing this.
Even if I use aspatial="Z=Year", It doesn’t appear what I expected. aspatial="Z=Year" it has also the date attributes.

Or I think there is some other issue or I am doing some mistake.

you should try aspatial="Z=Year_only"

Hi Mikhail,

Thanks.
aspatial="Z=Year_only" did not work. It gives the same plot with red outlines, as shown in my first comment.

Is it something like the issue with the pen color?

Arindan

import pygmt
filename = 'footprint/footprint_each_DEMs.shp'

fig = pygmt.Figure()
pygmt.makecpt(cmap="vik", series=[2017, 2021, 1], continuous=True, reverse=True)
fig.plot(data=filename,
         cmap=True, 
         color='+z', 
         close=True, 
         aspatial='Z=Year_only',
         pen="thinnest,red,-"
        )
fig.colorbar(position="jMR+jMR+w8c+o0.1c/1c+e")
fig.show()

1 Like

Hi Mikhail,

Thanks for this. I was looking for this.
What was the mistake in my code is: I was using geopandas to open the shapefile.
Like: footprint_each_DEMs = gpd.read_file(topdir + '/Footprint of dh/footprint_each_DEMs.shp')

Thanks for giving it a try and the solution.

Best, Arindan

I actually have no idea how to do it using geopandas

I would be glad to learn if somebody who knows could explain it to us.