These are few out of many script I used
gmt psxy vol_IndianO.txt -R93/109/-17/-1 -JM6i -Sf0.25+t -Gpurple -B4 -W0.2p -K -O > result.ps and
gmt psxy vol_IndianO.txt -R93/109/-17/-1 -JM6i -Stp -Gpurple -B4 -W0.2p -K -O > results.ps
Try -St0.25c. I think it should work.
thank Sir, I will try this on Monday in my office, office closed on Sunday here. Am grateful Sir
As @Esteban82 wrote -Sf ... +t is used to plot fault zones or subduction zones with the triangles pointing in the defined direction. To plot single triangles at the specified location -St0.25 is the way to go. If you want to plot a custom volcano symbol e.g. see http://gmt.soest.hawaii.edu/doc/latest/gallery/ex20.html.
The problem is the data file format with non # headers and no -h option, pipes as field separators, etc. This has been called to attention two times before but …
You are right Sir, thanks for the reminder, I will keep this in mind. It was appended in my interpolated data actually not the global derived data.
@mgrund, Hello Prof. many thanks it worked, am very grateful
Yes Sir, it worked with your suggestion, many thanks, am very grateful
this link is either broken or unable to open
just copy/paste it …
hello,
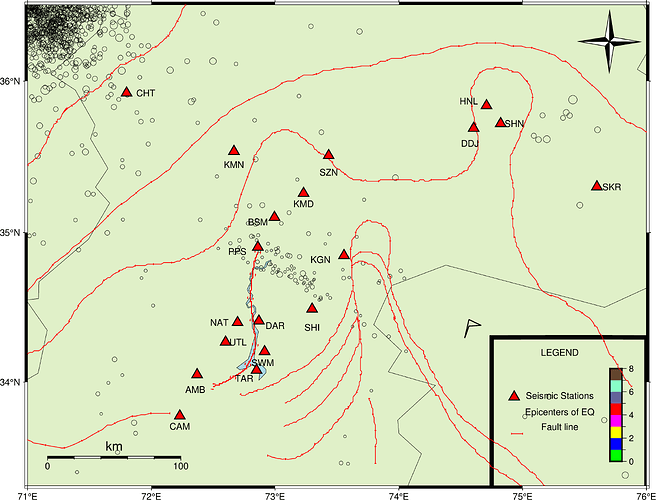
Im also new and trying to plot a map with earthquake data. Using gmt 6.4 and the code:
gmt begin magtar450 png
gmt coast -R71/76/33.3/36.5 -JM10i -C -Ba1f1 -W1 -G224/240/200 -Lf71.7/33.50/33.50/100+lkm -TdjTR+f+w1i -N1 -W1 -DlBC+o0/0.35i+w4.5i/0.1i+h
gmt psxy mag450km.txt -JM10i -Scp -i0,1,3+s2 -Z -Cmag.cpt
gmt psscale -DjRB+w1.5i/0.5c+o1/1c -Cmag.cpt -Baf
…the code goes on to make the map
I want to make the map plot earthquake events with size and color from txt file as seen in magnitude colorscale.
the data file has data as:
75.00 34.00 2.6
76.33 33.00 3.4
with no headers in text file and as longitude latitude and magnitude only.
Cant get the circle fill according to the magnitude defined in cpt file.
Perhaps you should not reference a non-existent column 3 since you only have column 0-2 to play with?
Thanks for the quick response.
OK. since I’m trying to figure out what part of code I’ve done wrong. Can you tell what to write exactly to get color and size of magnitude as per column 3 of text file?!
I would try
gmt psxy mag450km.txt -JM10i -Scp -i0,1,2,2+s2 -Cmag.cpt
i.e., use the magnitude column twice; both to look up colour and to set the size. But I think scaling your magnitudes by 2 will give pretty large symbols in cm, like 5.2, 6.8 cm etc. Perhaps you wish to change that.
It worked!!! Thank you so much, I’ve been at it for a few days. I did test scaling the magnitude size and s2 is the right size for my map.
