Hello Professors and Seniors
I have some difficulty with the use of psxy to plot circles of different diameters on my projected map. The txt files here contain earthquakes magnitudes and the coordinate, I tried to set the psxy in my script but didn’t fill the map with the earthquakes magnitude points. How can I solve this?
The script I used is gmt psxy earthquake_chrisp.txt -R93/109/-17/-1 -JM6i -Sc -Ggrey -K -O >> mean_400_600_800.ps
Many thanks
A sample of what I want to do is this, the circles represent earthquake fill points

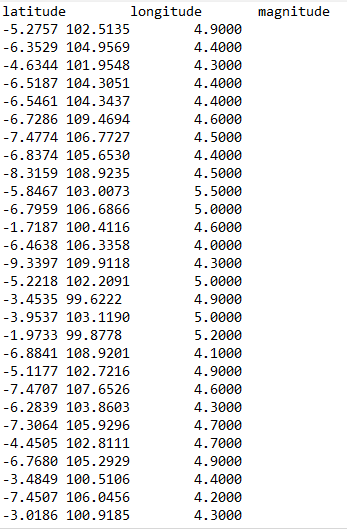
In which order do the coordinates and magnitudes appear in your input file?
Hello Sir, @mgrund they are randomly scattered, here is just a small photo of the input file
First of all remove the header line, then it should work.
I have removed the header from the txt file still didn’t show up, I used this script in my gmt
gmt psxy north_chrisp.txt -R93/110/-17/-1 -JM6i -Sc -Ggrey -K -O >> chrisp.ps
Could you provide a short snippet of your code including the first few commands you use to set up the map?
sure I will tomorrow because I have been out of office since, many thanks @ mgrund , can you send me your email as well. I really need this distribution map. grateful.
Your data is latitude and longitude. GMT expects longitude first. Add -: to the command.
I have changed it to longtitude latitude and mag but got this

yes this is the code I used to set up the map: I have even changed the data column as suggested to longtitude, latitude then mag.

Next time please provide your code in text form so everybody can just copy/paste it.
Here’s a minimal example that works fine on my machine using GMT 6.0.0:
#!/bin/bash
gmt psbasemap -R93/109/-17/-1 -JM6i -Ba4 -BWNSE -K > testmap.ps
gmt pscoast -R -J -Dh -O -K -I1 -Gred -A500 -W0.4p -N1/0.4p >> testmap.ps
gmt psxy infile.txt -R -J -Sc -Ggray -B20 -O >> testmap.ps
infile.txt contains the following values:
102 -5 4.9
100 -12 3
96 -15 2.5
and here’s the output figure:

1 Like
The size is too big. Try -Scp or -Scc instead of -Sc.
Many and plenty of thanks to you , I got it from your example. Am indeed grateful.
Many and plenty of thanks to you , I got it from your example. I am indeed grateful… Yes I added the -Scp instead of -Sc
Hello Sir, I tried to append volcanoes using triangle as the symbol , but it didn’t show as expected. I used
gmt psxy vol_IndianO.txt -R93/109/-17/-1 -JM6i -Sf0.25+t -Gpurple -B4 -W0.2p -K -O > result.ps and
gmt psxy vol_IndianO.txt -R93/109/-17/-1 -JM6i -Stp -Gpurple -B4 -W0.2p -K -O > results.ps and other trials but the triangle to represent my volcanoes on my map didn’t show up. Such as the formal figure
Here is the rough data format

The purple triangle represent volcanoes , how can I adjust my script for this to get this triangles on my map

Many thanks
Please, don’t use screen captures to show numbers or text. Just copy past them here and wrap them under triple ticks to get a better format
@Joaquim, Hello Prof. I do apologize for that ,
here is the data
|Longitude|Latitude|Elevation|
|---|---|---|
|105.4230|-6.1020|813.0000|
|112.3080|-7.9300|1731.0000|
|114.0420|-8.1250|3332.0000|
|110.4420|-7.5420|2947.0000|
|107.8300|-7.1300|2249.0000|
|108.4000|-6.8920|3078.0000|
...
I think that -Sf0.25+t is to draw faults with triangles. Check in the psxy manual the letter for triangles.
yes I did use the -Sf0.25+t , but still no result.
I even used -Stp, where -St denote triangle but , when I used this, it didn’t show the triangle just as it is on the previous posted map.