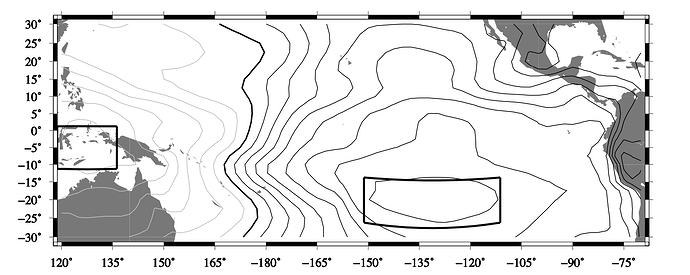
Hello All:
I’m trying to plot a pscoast map of the Pacific Ocean (125 E - 75W, 30N - 30S) that includes an psxy outline of the South Pacific Southern Oscillation center-of-action region (15S - 25S, 112.5W-150W).
I’m using a Mercator (-Jm) projection because I want the edges of the rectangular South Pacific psxy outline (and another west tropical Pacific outline) to appear straight. My problem is that the South Pacific outline’s 15S and 25S boundaries appear curved.
I thought with a Mercator projection constant latitude lines would be straight.
Should I be using a different projection, or am I just doing this wrong?
Script is below. I’m using version gmt version 6.3.
Thanks in advance for any help,
Steve M.
# Plot Pacific map
gmt pscoast  -R-241.25/-68.75/-31.25/31.25  -Ba15/a5WSne  -Dc -P  -G120/120/120 -K  -X1.5 -Y7.0   -Jm-155.0/0.0/0.0875c >! Fig4.ps
#
# Convert eof.xyz to temp.grd  -I150m/150m
gmt xyz2grd eof.xyz -Gtemp.grd -J -I2.5/2.5 -Ddegree/degree/uwnd/=/=/=/=  -r  -V  -R
#
# Reassign all null values as NaN in temp0.grd file
gmt grdclip temp.grd -Gtemp0.grd -Sa1.0/NaN -Sb-1.0/NaN -V
##
# Contour all negative correlation values @ 0.10 increments in gray
gmt grdcontour  temp.grd -R -B -J -P -C0.10   -W0.50p,gray  -Ln  -K   -O  -V     >> Fig4.ps
#
# 0.0 Contour in thick black
gmt grdcontour  temp.grd -R -B -J -P -C0.0,   -W1.00p,black      -K   -O  -V     >> Fig4.ps
#
# Contour all positive correlation values @ 0.10 increments in black
gmt grdcontour  temp.grd -R -B -J -P -C0.10   -W0.50p,black   -Lp  -K   -O  -V     >> Fig4.ps
#
#
# Plot outline of west Pacific averaging area
gmt psxy -R -J  -B -W1.5,black -P -m  -K -O  << EOF >>& Fig4.ps
>
-241.25    -11.25
-223.75    -11.25
>
-223.75    -11.25
-223.75      1.25
>
-223.75      1.25
-241.25      1.25
>
-241.25      1.25
-241.25    -11.25
EOF
#
# Plot outline of South Pacific averaging area
gmt psxy -R -J  -B -W1.5,black -P -m  -K -O  << EOF >>& Fig4.ps
>
-151.25   -26.25
-111.25   -26.25
>
-111.25   -26.25
-111.25   -13.75
>
-111.25   -13.75
-151.25   -13.75
>
-151.25   -13.75
-151.25   -26.25
EOF
#
