Using oblique mercator with earth relief bathymetry

I am creating maps in oblique mercator projections for a publication.
I have succeeded in creating these maps with the following code:

fig = pygmt.Figure()
fig.coast(projection="OC-3/146.0/145.7/-10.7/6c",
    region="143/-7/160/0+r",
    frame="afg",
    land="olivedrab",
    shorelines="1/thin",
   water="aliceblue",
)
fig.show(width=1000, dpi=500)

However, for some projections (like the one above) the coastlines look very jagged. Is this just a result of the projection? If I try the same with a different projection (OC-3/146.0/143.8/36.5/6c) the coastlines look more normal. I’m hoping to make these panels in the same figure and I’m wondering why they look so different.

Ultimately, I need to add bathymetry to the background. I am trying to do this by:

grid = pygmt.datasets.load_earth_relief(resolution="30s", region=[143.0, 154.0, -6.0, -2.0])
fig = pygmt.Figure()
fig.grdimage(grid=grid, projection="OC-3/146.0/145.7/-10.7/6c", frame="a", cmap="geo")
fig.colorbar(frame=["a1000", "x+lElevation", "y+lm"])
fig.show()

I am getting the following error:
Module ‘psconvert’ failed with status code 79:
psconvert [ERROR]: System call [gs -q -dNOSAFER -dNOPAUSE -dBATCH -sDEVICE=bbox -DPSL_no_pagefill -dMaxBitmap=2147483647 -dUseFastColor=true ‘/Users/annaledeczi/.gmt/sessions/gmt_session.29035/gmt_27.ps-’ 2> ‘/Users/annaledeczi/.gmt/sessions/gmt_session.29035/psconvert_29035c.bb’] returned error 256.

Is it possible to use an oblique mercator proejction on earth relief imagery?
Thanks!
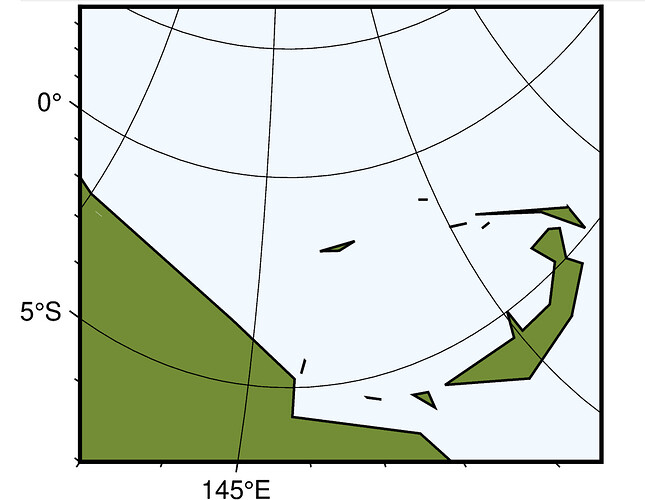
the bottom part of your region size is actually very small, so you need to specify the use of high-resolution coastline, see Coastlines and borders — PyGMT
your “different projection” actually defines a much larger region so the default coastline resolution looks “more normal”.

yes it is possible.
Thing is you have to extract a rectangular earth relief dataset that covers your whole oblique region of region="143/-7/160/0+r"

in command-line interface the rectangular region can be autodetected using mapproject’s -Wr or -WR option, see this illustration to mapproject’s -W option

as far as I can understand, mapproject is not directly available in pyGMT. You can call it using pygmt.clib.Session(), like below (or find out the extent of the rectangular region extent visually by plotting grid with a small step size):

import pygmt
from pygmt.clib import Session
from pygmt.helpers import GMTTempFile

projection="OC-3/146.0/145.7/-10.7/6c"
region = "143/-7/160/0+r"

with Session() as s:
    with GMTTempFile() as fout:
        s.call_module('mapproject', args=f'-R{region} -J{projection} -Wr > {fout.name}')
        R = fout.read().strip()

W,E,S,N = R.split()
print(f'The rectangular region is [{W}, {E}, {S}, {N}]')

grid = pygmt.datasets.load_earth_relief(resolution="30s", region=[W, E, S, N])
fig = pygmt.Figure()
fig.grdimage(grid=grid, projection=projection, region=region, frame="afg1", cmap="geo")
fig.colorbar(frame=["a1000", "x+lElevation", "y+lm"])
fig.savefig("obr.png", show=True)

NB frame="afg1" shows gridlines plotted every 1 degree, visually illustrating the extent of the rectangular region that needs to be extracted using pygmt.datasets.load_earth_relief(), approx [135, 160, -8, 8]

Thank you so much! I’ve been puzzling over this for weeks.