Using xyz2grd or mapproject to show satellite imagery along a swath in orthographic polar projection

I’ve been making animations of satellite images of the aurora (VIIRS DNB on the SUOMI-NPP and NOAA-20 satellites), which are provided as NetCDFs with three 2D grids of which the x- and y-coordinates represent the scan-lines and the pixels along the scan-lines of this instrument, respectively. One grid contains the measured brightness, and two others the longitudes and latitudes of these pixels. So these are regular grids, but with irregularly spaced longitudes and latitudes.
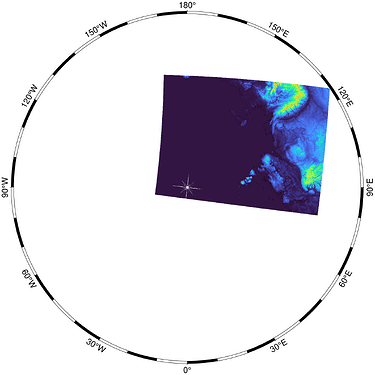
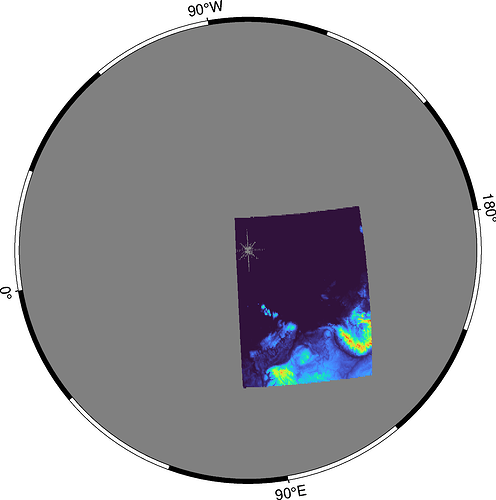
Since I’m interested in the aurora visible in these images, I’ve chosen orthographic projections centred on the North and South poles, and with the central longitude of the projection to be the longitude of the sub-solar point (e.g. using f-string substitution in the pygmt.grdimage call: projection=f"G90/{subsolar_lon}/15c"). In this way I can create animations of the Earth’s surface rotating beneath the swath of the satellites. Examples are available here:

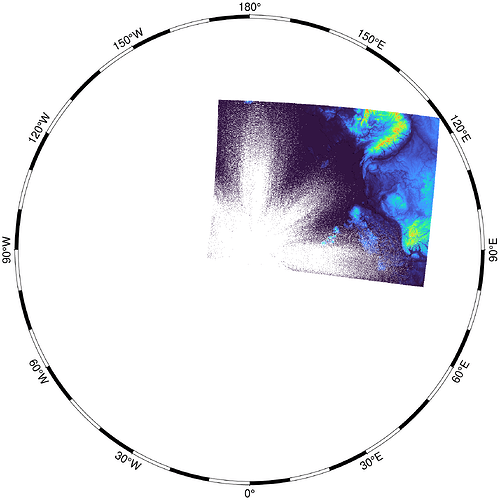
That second example shows a problem, because the swath goes over the pole. I’ve used pygmt.xyz2grd to convert each data file to something that grdimage can handle, but the output of that uses a regular latitude/longitude grid, so near the pole the output grid’s pixels represent very small areas. This results in the noise and star-like pattern of grid pixels containing NaNs at the pole. The projection/-J argument to pygmt.xyz2grd does not seem to make any difference.

I tried using mapproject (using os.system in python, since it’s not yet in pygmt) to create a grid directly in the desired orthographic projection, and then plotting the result with grdimage with -JX projection (since the grid coordinates no longer represent lat/lon). This looks good, but since the subsolar point changes for each frame, this means the projection changes for each frame, and I would have to run mapproject for every input file and for every time step of the animation. At that point, it takes longer than real-time to produce an animation. I think this is also slow because mapproject uses an ASCII table for its input, so I need an intermediate step to convert the input NetCDFs to this ASCII format.

Would there be a more computationally efficient way to circumvent this problem? Perhaps with other tools? Can I plot the mapproject output with a fixed central longitude with grdimage, but applying a rotation to align with the sub-solar point in some other way?

I think ideally grdimage would just understand the format in which the latitudes and longitudes of the input data are provided in separate arrays, and/or pygmt.xyz2grd would make clever use of the desired projection.

I see this convention of separately provided lat and lon grids for each pixel in other satellite data and model output NetCDF files as well, so I wonder if others have found a better solution.

Source code, in the form of Jupyter notebooks, is available here: https://gitlab.com/KNMI-OSS/spaceweather/notebooks/-/tree/main/viirs_day_night_band
1 Like

Hi, very neat animation !
I don’t get why the “regular lat/lon grid” is a problem for the projection ?
You’re saying that the NaN’s in the noise-star pattern are created after you convert your data with xyz2grd ? Could it be a simple precision problem ? Have you tried a smaller spacing ?

pygmt.xyz2grd(x=lons_geo, y=lats_geo, z=values, region=region, spacing=0.05, outgrid=grdfile)

(or you could interpolate grid to oversample afterward, but it might be less efficient?)

I’m not familiar with pygmt, but this line in create_frame is no good :

 Your grid y's or latitudes appear to be outside the map region and will be skipped.

Thanks for your reply. I’ve tried different spacing settings. The problem actually goes away with a much larger spacing, but then of course I loose resolution. The smaller the spacing, the smaller the lat/lon grid cells near the poles will be, and the larger the chance that there will be no pixels from the satellite falling into that lat/lon cell. Oversampling might be an idea, but I think that I have to try to circumvent using a regularly spaced lat/lon grid as an intermediate step, and find an efficient way to do so. The fact that xyz2grd contains a “projection” parameter was promising, but it does not seem to work for me here.

The warning about the grid falling outside the map region is caused by the covering only a limited range of latitudes (they are 6 minute parts of the satellite swath). I plot the Northern and Southern hemispheres separately, but just throw all the grids at grdimage for both subplots, without first checking whether a grid I’m trying to plot on the NH, for example, really contains data for NH latitudes. The warning is just grdimage saying that it is doing this checking for me :-).

The problem actually goes away with a much larger spacing, but then of course I loose resolution.

In that case, a “dummy” way I’d try (because it is simple enough to implement with the code you already have written) is to treat with a nice resolution everything then overlay a coarse resolution just above the poles.
1 repeated line for xyz2grd (on the small region)
1 repeated line for grdimage

(Not a real solution, but maybe a workaround?)
The GMT gurus might be of a better help here…

Condensing the problem into a single shot case would certainly help. Confess that only by skimming the description I have no real idea what the problem is.

Yes, overlaying two grids could work as a workaround. I’ve been digging a bit more through the docs and this could also be done with grdblend, but I also think that grdfill and filling by nearest neighbour or spline could be the right tool to fix this.

Still, directly creating and plotting a projected grid, like with mapproject, but able to use the input NetCDF data, would have been nicer, avoiding the regular lat/lon-grid singularity at the pole, and not requiring any workaround.

I’m a genius :sunny:

quote=“eelcodoornbos, post:6, topic:2290”]
Still, directly creating and plotting a projected grid, like with mapproject, but able to use the input NetCDF data, would have been nicer, avoiding the regular lat/lon-grid singularity at the pole, and not requiring any workaround.
[/quote]

Could it be a bug ? @pwessel

Sorry about the verboseness. Here’s a condensed code block:

import requests
import os
import netCDF4

# Download the data file
grid_url = 'https://surfdrive.surf.nl/files/index.php/s/vkCg91XdmRkhkiT/download'
viirs_filename = 'test_viirs.nc'
if not os.path.isfile(viirs_filename):
    r = requests.get(grid_url)
    if r.ok:
        with open(viirs_filename, 'wb') as fh:
            fh.write(r.content)
    else:
        print("Error downloading VIIRS test file")

# Extract the data from the NetCDF file
ncdata = netCDF4.Dataset(viirs_filename)
longitudes = ncdata['geolocation_data']['longitude'][:].flatten()
latitudes = ncdata['geolocation_data']['latitude'][:].flatten()
# Using the geolocation height here as the Z- variable, as the
# VIIRS DNB brightness data (for viewing the aurora) is stored in a different NetCDF file.
heights = ncdata['geolocation_data']['height'][:].flatten() 

# Set the longitude of the subsolar point, for the alignment of the plot
lonsubsolar = 80.0 
# I've set a random number here, not specific to the acquisition time of this data file
# The point is that grdimage can then nicely rotate the projected grid, as well as the frame, 
# the coastlines to be added, etc. This does not work when using mapproject instead of xyz2grd.

# Create the plot
fig = pygmt.Figure()
grid_gap = pygmt.xyz2grd(x=longitudes, y=latitudes, z=heights, spacing=0.1, region=[-180,180,50,90])
fig.grdimage(grid_gap, region=[-180,180,50,90], projection=f'G{lonsubsolar}/90/10c', frame=True)
fig.savefig('test_viirs1.png')
fig.show()

The output shows a star-like pattern of NaN grid cells around the North pole, because xyz2grd is missing input pixels inside those tiny lat/lon output cells there.

Using a larger lat/lon spacing can make this go away, but we loose detail from the original image, and the grdimage edges at the input grids boundaries will get jagged because of the lower resolution.

I’ve also just tried grdfill with this example. It fills the star-like pattern nicely, but also all the other NaN lat/lon cells over the rest of the globe where there is no input data. These should remain at NaN (so they can be set to transparent in the real script).

If grdfill works as you expect, can’t you use grdclip to isolate the area you want to fill and avoid the other “NaNs”

Another suggestion :
If the problem is “the values get too small near the pole”, can’t you scale up the whole with xyz2grd -G+s ?

The xyz2grd G+s option scales up the values, but it’s the cells that become too small.
I don’t see how grdclip would help with that either, as it also works on values, not locations. But perhaps grdmask would work, if I can extract a curve representing the border of the image. I’ll keep this in mind, but was really hoping for a solution not involving a work-around around the high latitude issue with a lon/lat grid, such as some way to integrate the functionality of mapproject and grdimage, or a way to get the -J/projection option working in xyz2grd, or using another tool like GDAL, which I’m not yet familiar with.

Well, python was not what had in mind but I think I can read that.

The problem is that you cannot use xyz2grd because the data is not gridded. That’s why they ship the lon and lat arrays. You need to interpolate the height. Now, given the polar issue, one have two options.

  • convert to xyz, mapproject to PS and grid it
  • grid it in geogs and grdproject or just project the image.

Option 1 seems more correct bu also more work, so I just made a quick try with RemoteS

using GMT, RemoteS

G = grid_at_sensor("VNP03DNB_NRT.A2021308.0148.001.nc", "height", inc=0.01, V=true);
Extract lon, lat, SUBDATASET_3_NAME=NETCDF:"VNP03DNB_NRT.A2021308.0148.001.nc":/geolocation_data/height from file
Warning 1: dimension #1 (number_of_pixels) is not a Longitude/X dimension.
Warning 1: dimension #0 (number_of_lines) is not a Latitude/Y dimension.
Warning 1: dimension #1 (number_of_pixels) is not a Longitude/X dimension.
Warning 1: dimension #0 (number_of_lines) is not a Latitude/Y dimension.
Warning 1: dimension #1 (number_of_pixels) is not a Longitude/X dimension.
Warning 1: dimension #0 (number_of_lines) is not a Latitude/Y dimension.
Warning 1: dimension #1 (number_of_pixels) is not a Longitude/X dimension.
Warning 1: dimension #0 (number_of_lines) is not a Latitude/Y dimension.
Finished extraction (13134848 points), now intepolate
        nearneighbor  -I0.01 -R-180/180/60.46/90 -n+a -S0.02
imshow(G, proj=:guess)

This takes time and creates a big grid because 0.01 is too small for latitudes. The image also looks worse than in your example but is correct. We can use surface interpolation instead of nearneighbor (the default interpolation method used by the grid_at_sensor function, but that will highly increase the computing time. Other options is to increase the -S value and use different x_inc and y_inc values.

Warning: not all of these parameters may be controllable in the Julia grid_at_sensor() function, but just to give you an idea.

Now a VERY weird thing about this data. The bellow image was made by shading illumination the LATITUDE array.

Why the hell the latitude displays the same pattern as the height data array???

Thanks for your reply! And interesting find with shading the lats.

This is a geolocation product for a satellite image, so basically the latitudes and longitudes of the pixels on the satellite instrument’s camera are determined in ground processing, making use of the satellite’s orbit, attitude, instrument characteristics and a DEM of the Earth. So it makes sense to me that the lats and lons are slightly shifted over land based on the height in the DEM, for parts of the image where the instrument is looking sideways.

I’m not interested in the height in this file, but in the brightness in an accompanying file with the same shape array (not provided above to keep the example simple). The aurora emissions in the brightness data are ~100-400 km above the surface, so these lats and lons based on the DEM are actually not as accurate as it seems for my particular use of the data, but that does not concern me at the moment.

I will look into RemoteS. It’s new to me, but seems to be made for this type of data.

But then one should see the same effect in the longitudes, but we don’t. Shading the longitude array show no such effect. Anyway, not very important but still curious.

This dataset seems to have very different lon and lat resolutions. I made a change in the grid_at_sensor function to accept different x and y increments (in master only for now). and I can now do

G = grid_at_sensor("VNP03DNB_NRT.A2021308.0148.001.nc", "height", inc=(0.05,0.01), search_radius=0.15);

Increasing the search_radius also increases the computing time. I can now also produce a very nice Northern Star :smiley:

Note that you can also use the option outxyz=true and receive the xyz data instead of interpolating it.