Regarding step, this is something the user would typically provide. For example, they want the forecast with 48 hours lead time, so they request step=48. If the user requests an invalid step, or one that simply doesn’t exist, then maybe the best solution is to return an error code?
Well, the idea (and implementation) is that users may request all variables, levels and times. But have to put limits on the combinations of those.
Well then the default could be to download a record, regardless of what its step is. But if the user specifies a step, or list of steps, then only download those where the step field matches what is requested?
There’s something that you might be running into.
The time a particular forecast is valid is this:
valtime = modelruntime + step
There are four model runs per day (at 00, 06, 12 and 18Z), and for each the model step goes into the hundreds of hours. So each model run will produce a lot of data which overlaps the valid times from the previous run. The general hope is that more recent model runs are more skilful than the older ones.
From a data storage point of view the usual solution is to have no more than one model run in a NetCDF file (if that’s the format you want to use). The dimensions would be longitude, latitude, vertical level and time. Time might either have the units of an absolute time that the forecast is valid, or it might be relative to the model run time. In the end it’s six of one, half a dozen of the other - some users prefer to have times relative to the model run time, some prefer to have times be the absolute time the forecast is valid.
If one allows for more than one model run to be in a file, then difficulty ensues. One solution is to add another time dimension (for model run). Or alternatively, have two coordinate variables associated with a single time dimension. In either case some users are going to be unhappy, so restricting each file to just contain data from a single model run is the usual solution.
Vertical level can be painful too. The data are on several vertical levels. A lot are on constant pressure levels, but some are metres above or below the surface. And a few are top of atmosphere, mean sea level and possibly some other things. So it’s quite likely a user requesting multiple variables will end up with data on more than one vertical dimension.
When people at work complain about the difficulty, I commiserate with them, but then remind them if it was simple we’d be out of a job ![]()
Not sure how deep in that complication I’ll dive in, and don’t have much time to continue this right now. But since I started, I would like at least to be able to get precipitation forecasts. I need to protect the future of my chili-peppers. … and would also like to go up to 4D files for single model runs.
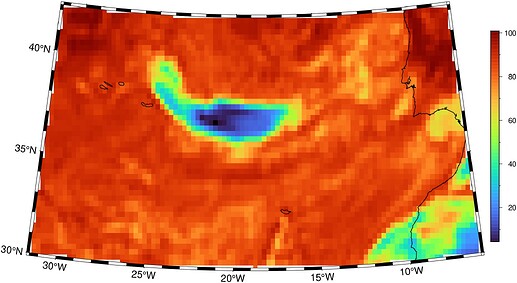
You maybe interested in knowing that (with the help of Even in the GDAL mailing list) when we know the _offset and length from the .index file we can do:
grdconvert /vsisubfile/802533_508958,/vsicurl/https://ecmwf-forecasts.s3.eu-central-1.amazonaws.com/20240301/00z/ifs/0p25/oper/20240301000000-24h-oper-fc.grib2 -RPT lixo.grd
and
julia> viz("lixo.grd", coast=true, proj=:guess, colorbar=true)
And a note. I find it amazing how the grib files are so much more compressed than the netCDF ones (even when using maximum compression level), Do you know what algorithm they use? To my knowledge only LAZ and one other from images world that I’m not remembering now, coud attain such a compression ratio.
OMG. That is so good!
Regarding compression, GRIB can use multiple types of compression. The gory details are in here: https://library.wmo.int/viewer/35625/download?file=WMO-306-v-I-2-2023_en.pdf&type=pdf&navigator=1 - see Section 5. ECMWF use something called CCSDS compression: https://confluence.ecmwf.int/pages/viewpage.action?pageId=146658047
Thanks, good to know what it is and even better, it’s based on a C library (not any C++ s…)
Tim, why do you scale the wind by this 1.94384 value?
Oh, that’s an evil thing meteorologists do - use knots for wind speed. The 1.9… is the conversion from m/s to knots. There’s a lot of history behind this, since wind speed is so important for ships.
And then there is aviation. Most of the western world uses feet for flight levels. But some countries use metres. There is a good safety reason for standardising the whole world on the same units - especially for flights that cross from countries using feet to those using metres. I’m sure you can see where this is heading - until a few years ago Russia used metres for altitudes. Now they use feet. I think China still uses metres. So feet are “winning” this unit war.
Regarding wind barbs, there is a convention in meteorology to have the “feathers” point towards the low pressure. This means in the southern hemisphere the feathers are on the right hand side of the barb, while they’re on the left hand side of the barb in the northern hemisphere.
The way I remember which side to put the feathers on is if you look at wind charts you’ll see cyclones (with low pressure in the centre) spin clockwise in the southern hemisphere and anticlockwise in the northern hemisphere. So in the southern hemisphere (clockwise spinning cyclones) the feathers need to be on the right side of the barb to point towards the low pressure. The reason for cyclones spinning in different directions in each hemisphere is to do with the direction of the coriolis force.
From memory (I’ll need to check this), the grdbarb module defaults to drawing southern hemisphere barbs, while the barb module defaults to northern hemisphere barbs. There’s an easy way to switch feather side - barb and grdbarb let one specify the angle of the feathers; this can be used to flip the side that the feathers are on.
The reason why ships use knots lies back in the Mercator projection where one easily measure distances in minutes/degrees on the N-S axis, and a knot is 1 NM/hr (~minutes/hr). But aviation uses land miles, not nautical miles. I always feel it’s stupid when flying and hearing the altitudes in feet. As if anyone was at ease with that unit to measure altitudes, even Americans.
But OK, I got it that wind barbs are traditionally in knots. I had some disciplines of Meteorology in my long time Geophysics degree and still remember those basics of atmospheric circulation and why you guys at the low under spin in the oposite sense. The difference between barb and grdbarb is not nice though.
(my GMT.jl ecmwf() function is almost ready for prime time)
They are pointing to low-pressure on the North.
julia> ecmwf(:forecast, var=["10u", "10v"], R="IHO23")
[ Info: Downloading 10u and saving to 10u_step0_ifs_oper_fc_20250517_00.grd
[ Info: Downloading 10v and saving to 10v_step0_ifs_oper_fc_20250517_00.grd

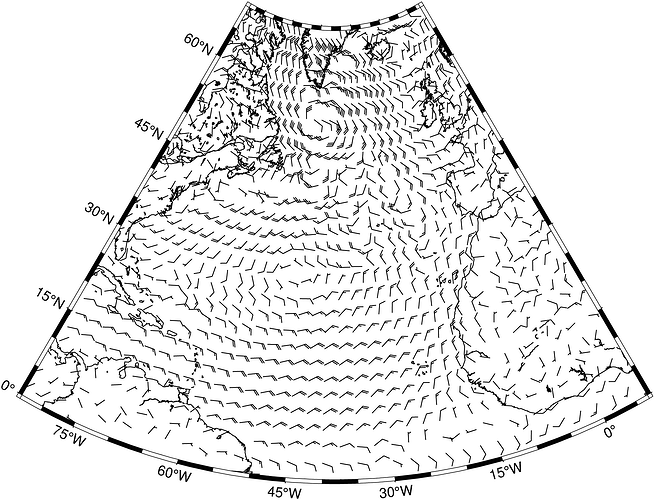
julia> windbarbs("10u_step0_ifs_oper_fc_20250517_00.grd", "10v_step0_ifs_oper_fc_20250517_00.grd", Q="0.25c+s20+w0.15c", I="x10", proj=:guess)
julia> coast!(shore=true, show=true)
And what do you think of the grdbarb’s +s modifier of -Q? The man says:
+s - Set the wind speed which corresponds to a long barb [default 5].
But being it, that info should be extracted from input, otherwise, and if we don’t check it manually, we risk to always fail to provide the good value of max speed.
If you’re using m/s for wind speed then 5 is a good default. If you’re using knots the usual value for a long barb is 10 knots, which is not too different to 5 m/s.
Hmm. grdbarb must be smart enough to to the correct thing. Now it makes sense, for time series of barbs I have the horizontal axis being time and I set the y value as 0.5 (I’ve got to set it to something). Barb probably thinks I’m in the northern hemisphere.
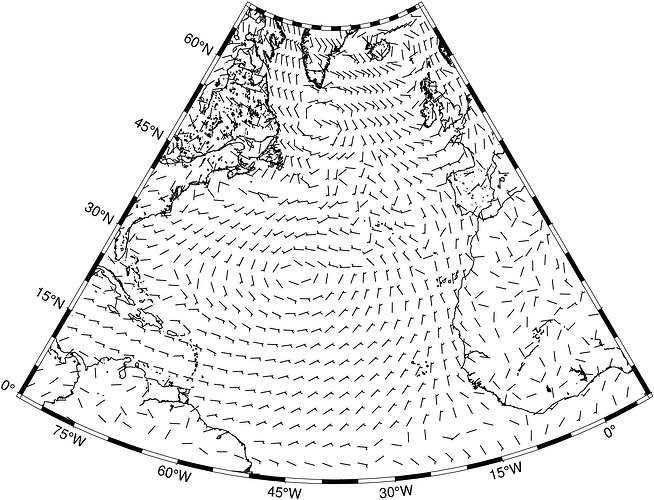
I am getting more confused with that +s flag. If I do not use it (and maybe grdbarb must be smart enough to to the correct thing) I get a better looking figure. Now I used a more verbose command because I’m facing some highly mysterious errors when using plain GMT syntax and nested commands (the coast=true)
windbarbs("10u_step0_ifs_oper_fc_20250517_00.grd", "10v_step0_ifs_oper_fc_20250517_00.grd", barbs=(length=0.25, width=0.15), inc="x10", show=true, coast=true, proj=:guess)
The +s seems to work fine for me. Here’s what I’ve been doing:
gmt grdbarb "${tmpdir}/ecmwf.nc?u10+s1.94384" \
   "${tmpdir}/ecmwf.nc?v10+s1.94384" -Wfaint,black \
   -Q0.25c+s10+w0.15c -Gblack -Ix1
The +s applies after any scaling of the winds has been done. So in the above, the easterly and northerly wind components are scaled by 1.94384 to convert from ms⁻¹ to knots. Then the +s in the -Q option makes the long barb equal to 10 knots (i.e. after the unit conversion, not before). And the wind speeds in my maps are matching up with the official forecasts here, so I think it is working properly.
I guess I was confusing the +s with the barb’s length.
BTW, I know you have your own recipe working but still, if you want to play a little with this, I hardly see how it can be simpler than (except the yet non-tackled [0 360] vs [-180 180] issue). Downloads both ERA5 and Forecast abstracting away the grib order mess and letting download sub-regions.
Nice. I’ll have to revisit the Julia stuff. I started learning Julia a couple of years ago - I used it, along with the GMT wrappers to do some stuff on compressing weather data using contour based methods: it’s here: GitHub - timo007/bincon
The article itself ran into an immovable reviewer. But I still found the Julia quite easy to use, and I liked the extra features like being able to plot streamlines.
The biggest self-imposed obstacle I face is that I’ve been using GMT since about version 2 from memory (circa 1993), when everything was shell script based. And I need to overcome the inertia to learn something new ![]()


