Hi!
I recently stumbled over this old(?) GMT script: gmt.soest.hawaii.edu – vertical slice
Script for posterity
#!/bin/bash
#
gmt set GMT_COMPATIBILITY=5 MAP_FRAME_TYPE=plain
#
#  f(x,y,z) = sin(x+y)*e(-(x+y)*(3 - (z/1e4)))
#
# create base grid (z = 0)
#
gmt grdmath -R-75/-60/-50/-40 -I0.005 X D2R Y D2R ADD STO@xySum SIN @xySum \
    3 MUL NEG EXP MUL = base.nc
#
# create slice grid (lon = -67.5) (-47.5 <= lat <= 42.5)  (0 <= z <= 999)
#
gmt grdmath -R-47.5/-42.5/0/999 -I0.005/0.5 X D2R -67.5 D2R ADD STO@xySum SIN @xySum \
    3 Y 1E4 DIV SUB MUL NEG EXP MUL = slice.nc
#
# dump slice grid and reproject X
#
gmt grd2xyz slice.nc | awk '{print -67.5,$0}' | gmt mapproject -R-75/-60/-50/-40 -JM-67.5/-45/16 | \
    awk '{print $2,$3,$4}'> points.txt
#
# calculate projected region X-limits
#
lMin=`echo '-67.5 -47.5' | gmt mapproject -R-75/-60/-50/-40 -JM-67.5/-45/16 | awk '{print $2}'`
lMax=`echo '-67.5 -42.5' | gmt mapproject -R-75/-60/-50/-40 -JM-67.5/-45/16 | awk '{print $2}'`
#
# re-grid slice
#
gmt surface points.txt -Gslice_cut.nc -R$lMin/$lMax/0/999 -I1500+/2000+ -C0.1 -T0.25
#
# create CPT
#
deltaZ=`gmt grdinfo -T10 slice_cut.nc base.nc`
gmt makecpt -Cseis -I $deltaZ -Z > colors.cpt
#
# make basemap (this is not necessary but...)
#
gmt basemap -R-75/-60/-50/-40/0/999 -JM-67.5/-45/16 -JZ8 -Bxa2f1 -Bya1f1 -Bza250f50g250+l"Km" \
    -B+b -BwESn -pz135/30+v10/5 -K > mag.ps
#
# plot base grid (z = 0)
#
gmt grdimage base.nc -R -JM -JZ -Bxa2f1 -Bya1f1 -Bza250f50g250+l"Km" -B+b -BwESn \
    -Ccolors.cpt -p -O -K >> mag.ps
#
# plot map (coast, country borders). Grid plotted to check slice location
#
gmt coast -R -JM -JZ -Bxa2f1g0.5 -Bya1f1g0.5 -Bza250f50g250+l"Km" -B+b -BwESn -Df -A0/0/1 \
    -N1/0.5p,black,-..- -W0.5p,black -p -O -K >> mag.ps
#
# calculate max X projected
#
xMax=`echo '-60 -40' | gmt mapproject -R-75/-60/-50/-40 -JM-67.5/-45/16 | awk '{print $2}'`
#
# plot slice
#
gmt grdimage slice_cut.nc -R0/$xMax/0/999 -JX15.0922064999/8 -Bxa0f0 -Bya250f50+l"Km" -Ccolors.cpt \
    -px135/30+v12.59/0.96 -O -K --MAP_FRAME_AXES='' >> mag.ps
#
# plot slice box
#
gmt plot -R -JX -W1p,black -px135/30+v12.59/0.96 -O -K >> mag.ps << EOF
$lMin 0
$lMin 999
$lMax 999
$lMax 0
$lMin 0
EOF
#
# add missing Z-box lines overwritten by slice plot
#
gmt plot3d -R-75/-60/-50/-40/0/999 -JM-67.5/-45/16 -JZ8 -W1p,black -pz135/30+v10/5 -O >> mag.ps << EOF
 -75 -50 999
 -75 -40 999
 -60 -40 999
 -60 -50 999
 -75 -50 999
>
 -60 -50 0
 -60 -50 999
EOF
#
gmt psconvert -Tg -Qt4 -Qg4 -E300 -P mag.ps
#
rm -f base.nc points.txt slice.nc slice_cut.nc gmt.history gmt.conf
I was wondering whether someone has made this work in GMT or pygmt since I have not been able to do so.
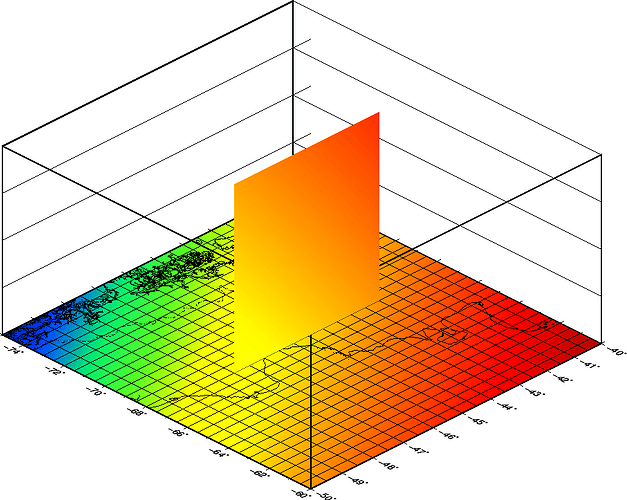
The output should look like this:
Thank You!
Cheers,
Lucas
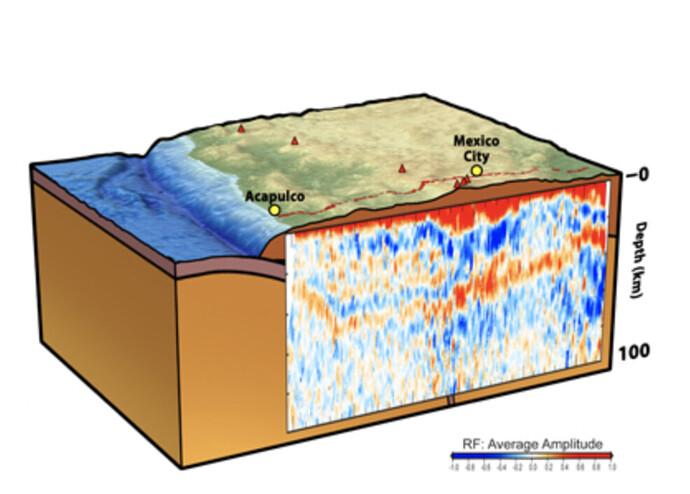
PS: My goal is something like the image below, but more accurate.
From [Perez-Campos et al., GRL 2008]


