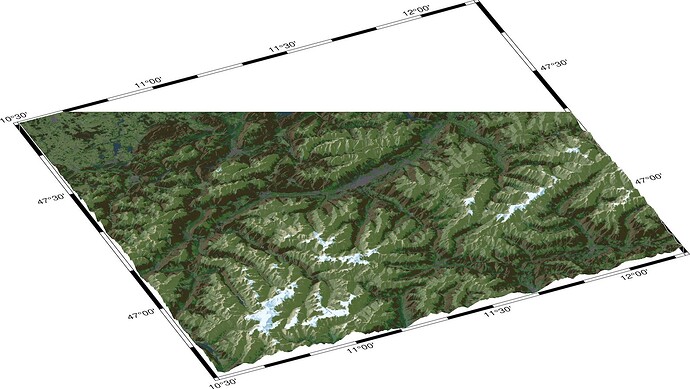
I’m trying to plot a perspective view of the Innsbruck, Austria area.
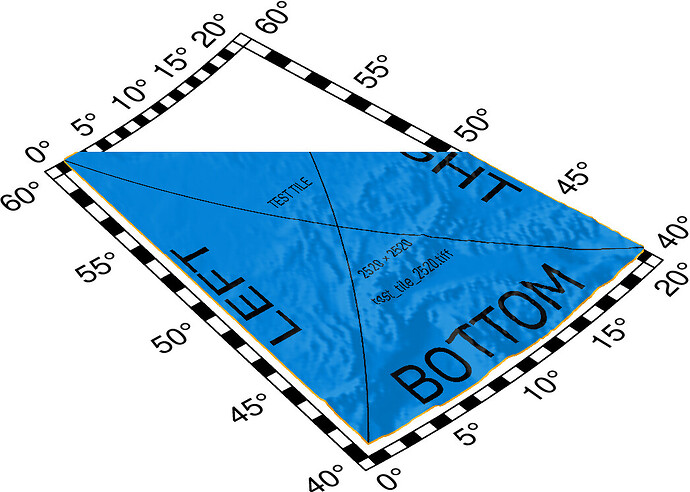
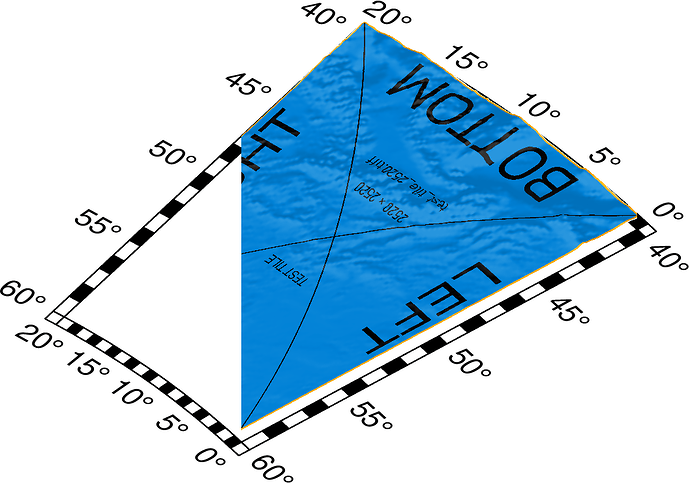
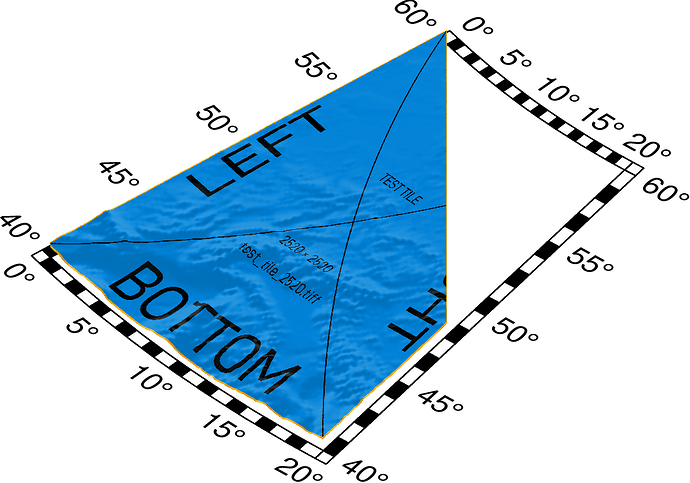
But for some reason the upper part remains invisible:
I don’t really understand why this doesn’t work.
Some code to play with:
inn_color.tif (334.3 KB)
gmt begin inn_true_colors_shaded jpg
  gmt basemap -JL11.5/47/46.5/47.5/20c -R10.5/12.2/46.7/47.8 -B -p205/35
  gmt grdview @earth_relief_03s -Ginn_color.tif -I+a315+ne0.3+m0 -JZ0.6c -Qi300 -p
gmt end show
Same thing here.
Thank you for confirming this @MarceloBanik . Pinging @pwessel and @Joaquim for some ideas?
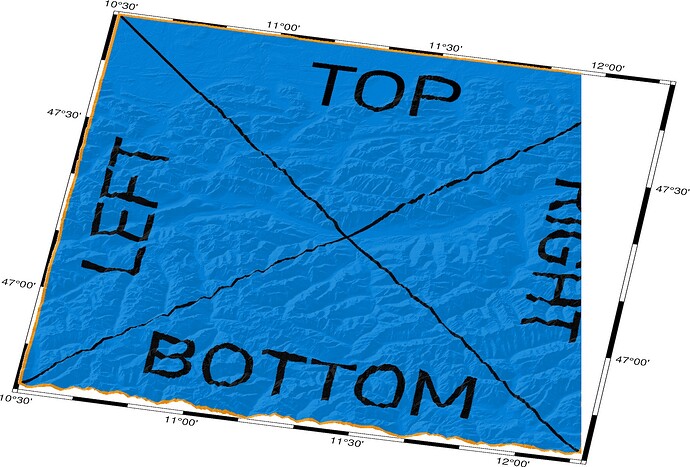
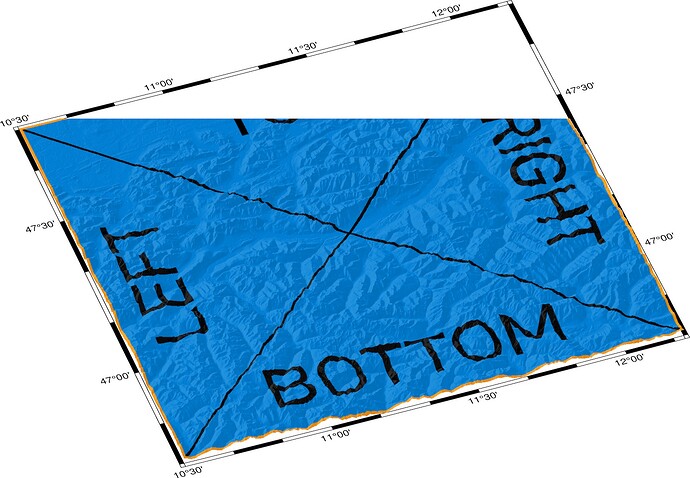
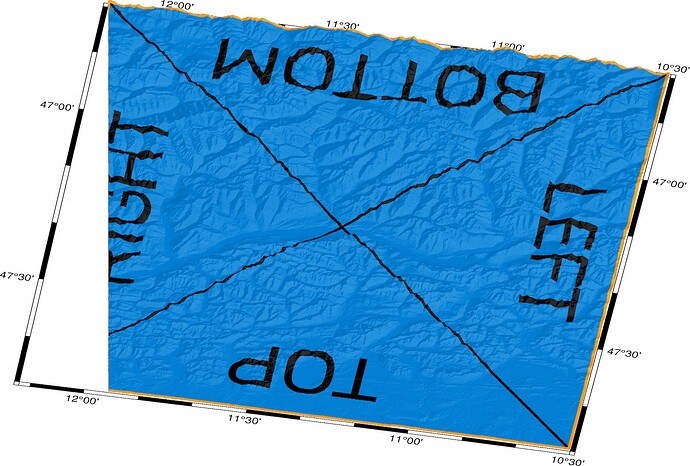
Still not sure what’s going on here. Some further experimentation:
-p170/45
-p200/45
-p350/45
Code to play with:
test_img.tiff (148.0 KB)
gmt begin p170_45 png
  gmt basemap -JL11.5/47/46.5/47.5/20c -R10.5/12.2/46.7/47.8 -B -p170/45
  gmt grdview @earth_relief_03s -Gtest_img.tiff -I+a315+ne0.2+m0 -JZ0.6c -Qi150 -p
gmt end show
Using GMT version: 6.2.0_3b552d3_2021.02.19
Joaquim
February 20, 2021, 5:03pm
5
Something is weird with that tif file
grdinfo inn_color.tif
inn_color.tif: Title: Grid imported via GDAL
inn_color.tif: Command:
inn_color.tif: Remark:
inn_color.tif: Pixel node registration used [Cartesian grid]
inn_color.tif: Grid file format: gd = Import/export through GDAL
inn_color.tif: x_min: 10.5 x_max: 12.2 x_inc: 0.00132501948558 name: x n_columns: 1283
inn_color.tif: y_min: 46.7 y_max: 47.8 y_inc: 0.000899427636958 name: y n_rows: 1223
inn_color.tif: v_min: 39 v_max: 238 name: z
inn_color.tif: scale_factor: 1 add_offset: 0
+proj=eqc +lat_ts=0 +lat_0=0 +lon_0=11.35 +x_0=0 +y_0=0 +R=6371007.181 +units=m +no_defs


gdalinfo inn_color.tif
...
Origin = (10.500000000000000,47.799999999999997)
Pixel Size = (0.001325019485581,-0.000899427636958)
Metadata:
  AREA_OR_POINT=Area
Image Structure Metadata:
  COMPRESSION=DEFLATE
  INTERLEAVE=PIXEL
Corner Coordinates:
Upper Left  (  10.5000000,  47.8000000) ( 11d21' 0.34"E,  0d 0' 1.55"N)
Lower Left  (  10.5000000,  46.7000000) ( 11d21' 0.34"E,  0d 0' 1.51"N)
Upper Right (  12.2000000,  47.8000000) ( 11d21' 0.39"E,  0d 0' 1.55"N)
Lower Right (  12.2000000,  46.7000000) ( 11d21' 0.39"E,  0d 0' 1.51"N)
Center      (  11.3500000,  47.2500000) ( 11d21' 0.37"E,  0d 0' 1.53"N)
Band 1 Block=256x256 Type=Byte, ColorInterp=Undefined
Even GDAL cannot convert from dd.xxxx to dd:mm:ss?
Hi @Joaquim , thank you for looking into this. I made a .tiff from scratch so no weird data in the file but the problem persists:
Have a try for yourself:
test_tile_2520.tiff (398.4 KB)
gmt begin tile_p225_45 png
  gmt basemap -JL10/50/46.7/55.3/5c -R0/20/40/60 -B -p225/45
  gmt grdview @earth_relief_10m -Gtest_tile_2520.tiff -I+a315+ne0.2+m0 -JZ0.4c -Qi300 -p
gmt end show
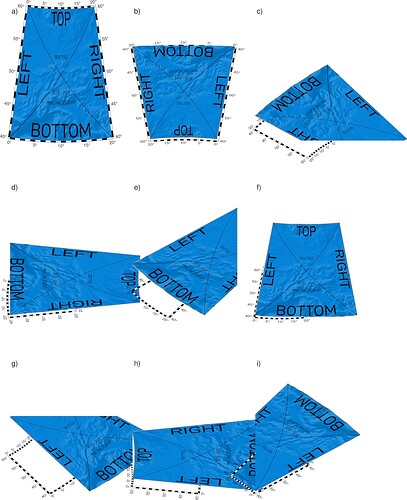
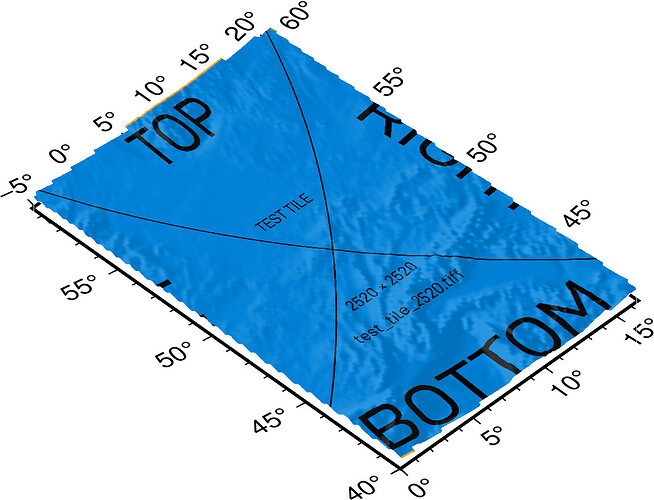
When I try to use it with the subplot machinery it gets really wild:
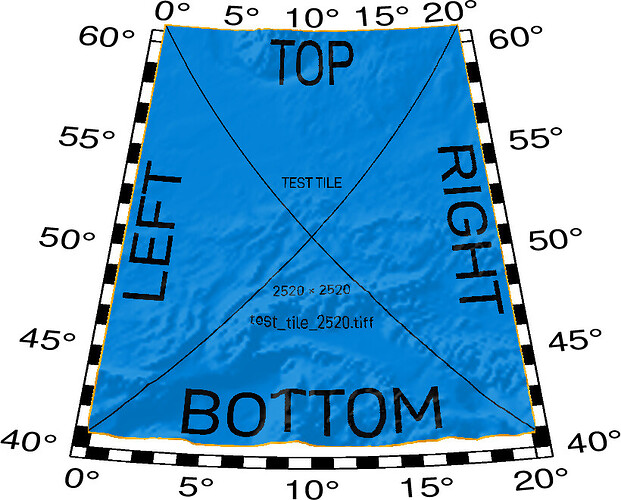
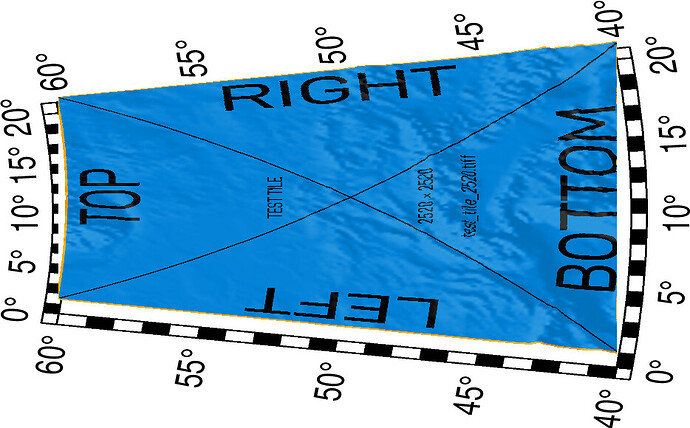
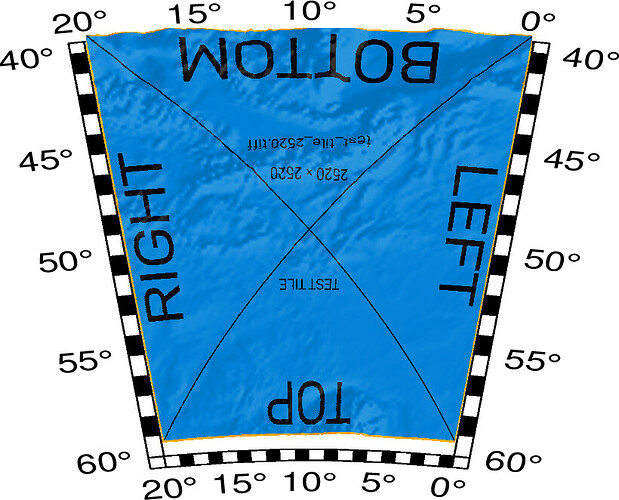
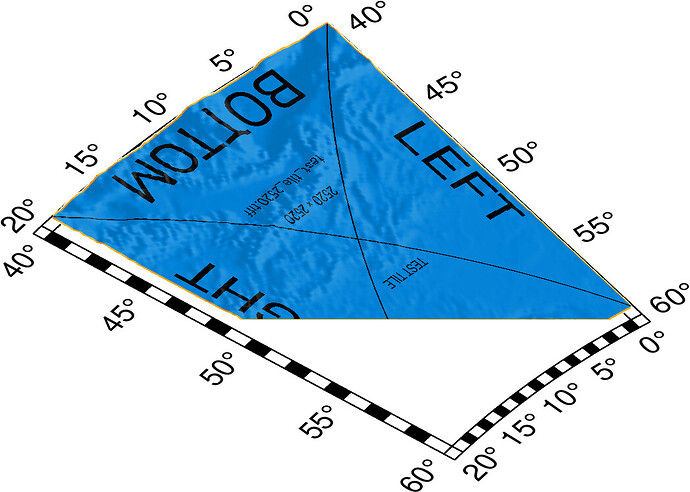
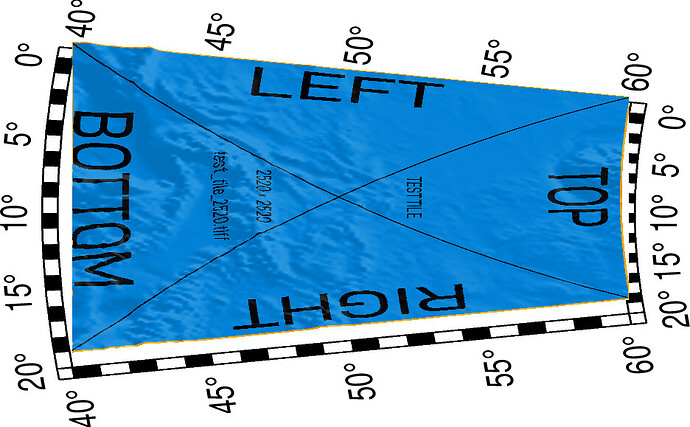
But I think there might be a problem with me using the subplot machinery or the subplot machinery itself as well. When I plot the different perspective views separately they only show the behavior of the missing areas but are scaled correctly:
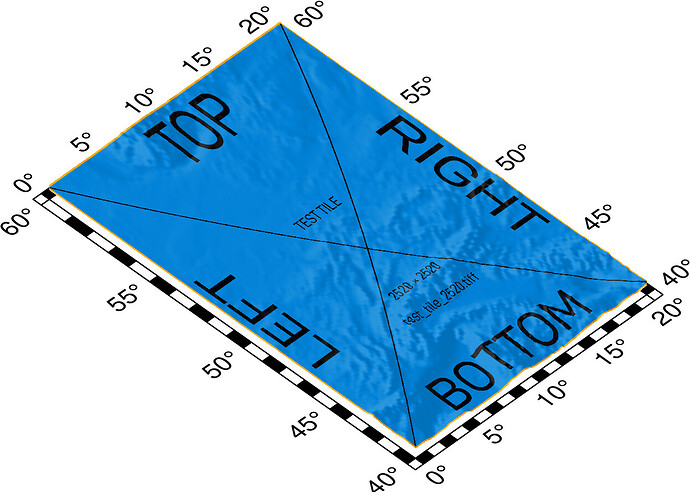
-p180/45 this appears to be correct
-p225/45 NE corner missing
-p270/45 southern rim missing, northern map frame is incomplete
-p315/45 NE corner missing
-p0/45 this appears to be correct
-p45/45 NE corner missing
-p90/45 southern rim missing, northern map frame is incomplete
-p135/45 NE corner missing
All the code to play with:
gmt begin tile_p0_45 png
  gmt basemap -JL10/50/46.7/55.3/5c -R0/20/40/60 -B -p0/45
  gmt grdview @earth_relief_10m -Gtest_tile_2520.tiff -I+a315+ne0.2+m0 -JZ0.4c -Qi300 -p
gmt end show

gmt begin tile_p45_45 png
  gmt basemap -JL10/50/46.7/55.3/5c -R0/20/40/60 -B -p45/45
  gmt grdview @earth_relief_10m -Gtest_tile_2520.tiff -I+a315+ne0.2+m0 -JZ0.4c -Qi300 -p
gmt end show

gmt begin tile_p90_45 png
  gmt basemap -JL10/50/46.7/55.3/5c -R0/20/40/60 -B -p90/45
  gmt grdview @earth_relief_10m -Gtest_tile_2520.tiff -I+a315+ne0.2+m0 -JZ0.4c -Qi300 -p
gmt end show

gmt begin tile_p135_45 png
  gmt basemap -JL10/50/46.7/55.3/5c -R0/20/40/60 -B -p135/45
  gmt grdview @earth_relief_10m -Gtest_tile_2520.tiff -I+a315+ne0.2+m0 -JZ0.4c -Qi300 -p
gmt end show

gmt begin tile_p180_45 png
  gmt basemap -JL10/50/46.7/55.3/5c -R0/20/40/60 -B -p180/45
  gmt grdview @earth_relief_10m -Gtest_tile_2520.tiff -I+a315+ne0.2+m0 -JZ0.4c -Qi300 -p
gmt end show

gmt begin tile_p225_45 png
  gmt basemap -JL10/50/46.7/55.3/5c -R0/20/40/60 -B -p225/45
  gmt grdview @earth_relief_10m -Gtest_tile_2520.tiff -I+a315+ne0.2+m0 -JZ0.4c -Qi300 -p
gmt end show

gmt begin tile_p270_45 png
  gmt basemap -JL10/50/46.7/55.3/5c -R0/20/40/60 -B -p270/45
  gmt grdview @earth_relief_10m -Gtest_tile_2520.tiff -I+a315+ne0.2+m0 -JZ0.4c -Qi300 -p
gmt end show

gmt begin tile_p315_45 png
  gmt basemap -JL10/50/46.7/55.3/5c -R0/20/40/60 -B -p315/45
  gmt grdview @earth_relief_10m -Gtest_tile_2520.tiff -I+a315+ne0.2+m0 -JZ0.4c -Qi300 -p
gmt end show
Joaquim
February 20, 2021, 7:11pm
7
There are weird things happening with images and projections. I already spent days trying to debug it but the pad
grdproject @earth_relief_10m -R0/20/40/60 -J+proj=lcc+lon_0=10+lat_0=50+lat_1=46.7+lat_2=55.3+x_0=0+y_0=0+ellps=GRS80+units=m+no_defs -Glixo.grd
grdproject [WARNING]: x_inc does not divide 180; geographic boundary condition changed to natural.

grdview lixo.grd -JX10 -Baf -BWSen -n+a -p205/35 -Qi300 -I+a315+ne0.3+m0 -Gtest_tile_2520.tiff -P > lixo.ps
Ok, do you have an idea how to work around this for the moment?
Joaquim
February 20, 2021, 8:51pm
9
Well, since my last example seems to work you may use it, together with what is done in example 28, as a workaround.
@Joaquim would you kindly explain to me how example 28 “Mixing UTM and geographic data sets” would help me?
Because when I use a rectangular projection like -JM it works out of the box:
gmt begin JM_tile_p225_45 png
  gmt basemap -JM5c -R0/20/40/60 -B -p225/45
  gmt grdview @earth_relief_10m -Gtest_tile_2520.tiff -I+a315+ne0.2+m0 -JZ0.4c -Qi300 -p
gmt end show
So I thought I give -JL -R+r a try but I’m not sure I understand what controls the placement of the draped image:
gmt begin pR_tile_p225_45 png
  gmt basemap -JL10/50/46.7/55.3/5c -R0/40/20/60+r -B -p225/45
  gmt grdview @earth_relief_10m -Gtest_tile_2520.tiff -I+a315+ne0.2+m0 -JZ0.4c -Qi300 -p
gmt end show
Joaquim
February 20, 2021, 10:01pm
11
Well, the idea is: if by projecting first and get cartesians the draping works then the technique in ex28 would allow drawing a geographic frame, if that is desired.
Ah, now I got it. Thank you!
