gmt begin rms png E600
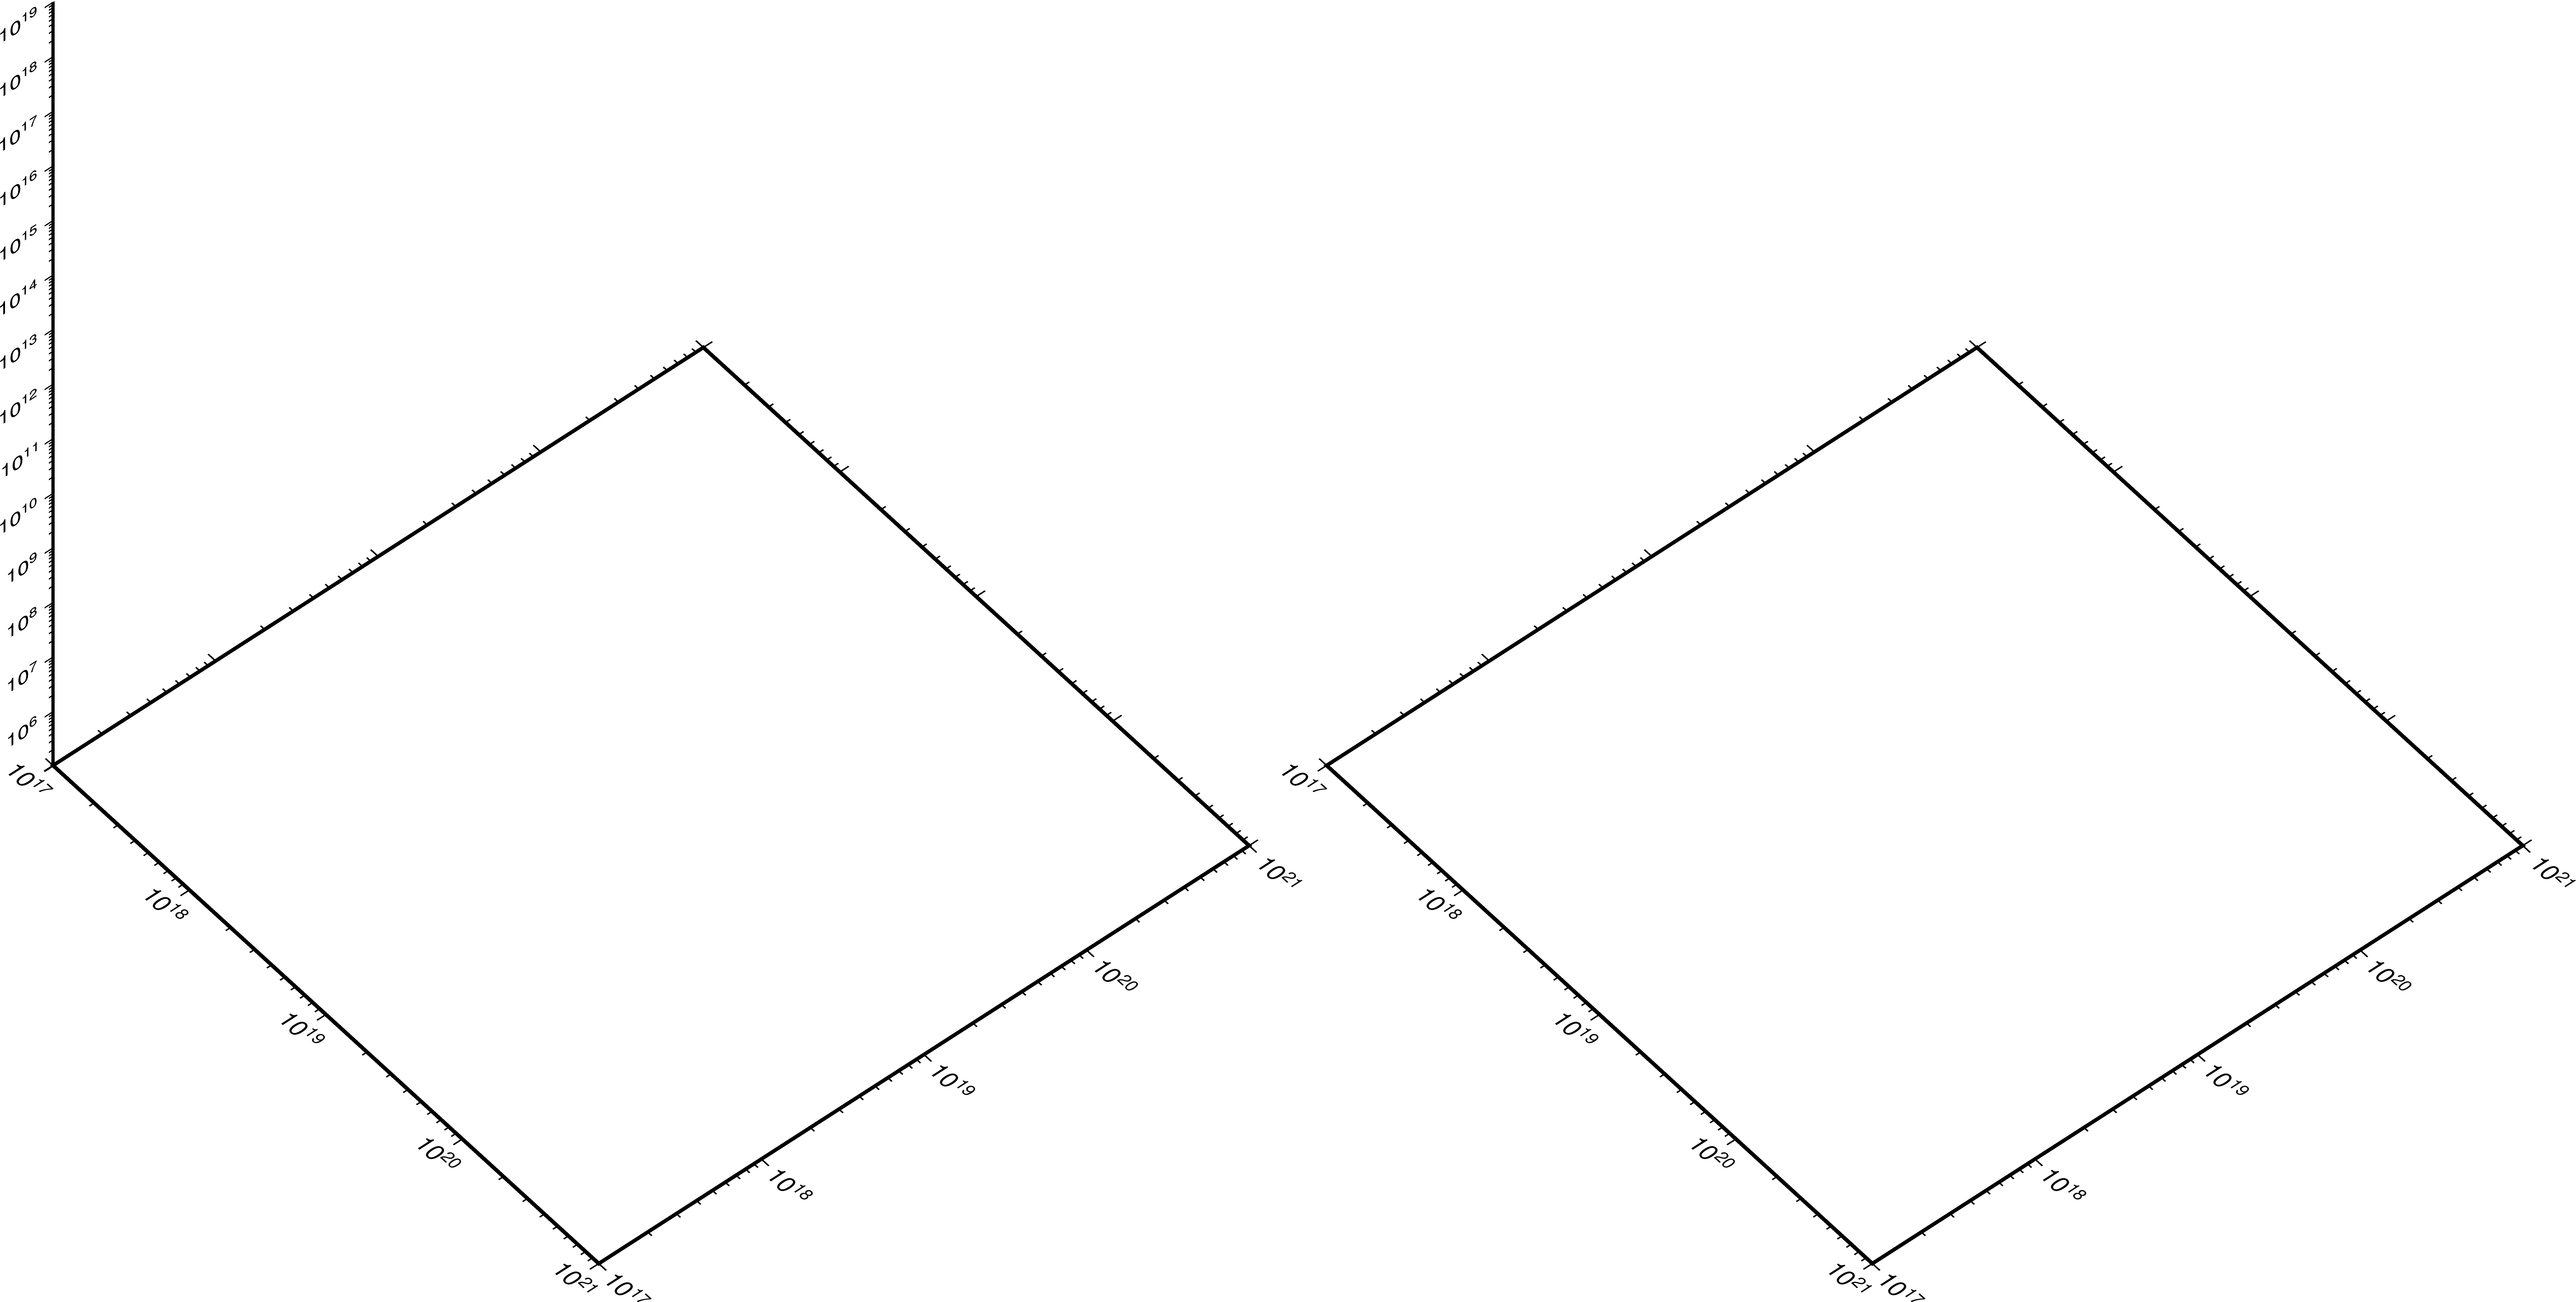
R=1e+17/1e+21/1e+17/1e+21/1e5/1e19
gmt basemap -R$R -Jz1cl -BwSEnZ -JX10cl -p130/50 -Bxa1f3p -Bya1f3p -Bza1f3p
R=1e+17/1e+21/1e+17/1e+21/1e10/1e19
gmt basemap -R$R -Jz1cl -BwSEnZ -JX10cl -p130/50 -Bxa1f3p -Bya1f3p -Bza1f3p -X15c
gmt end
Yes, see comment in #8812