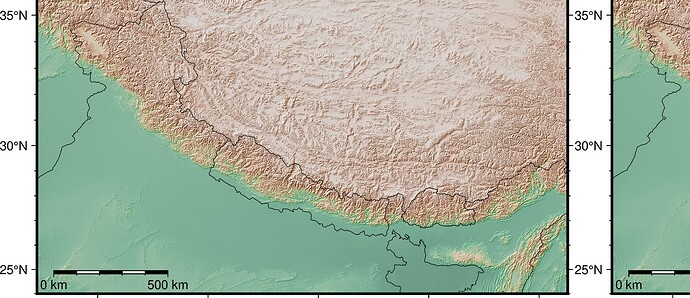
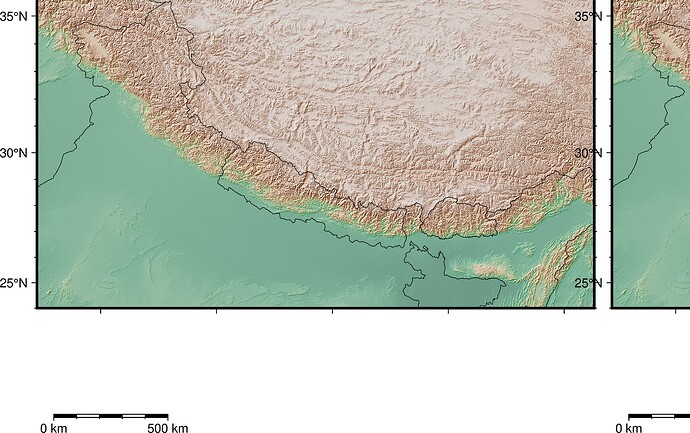
Hello everyone! I am experiencing an issue with plotting using PyGMT and would appreciate some help. My second panel subplot seems to be getting cut off. Can anyone suggest why this might be happening and how to fix it? I’d also appreciate input on ensuring both subplots display fully, especially with map scales and coastlines. Thanks!
proj = "M15c"

# Topography & CPT
relief = pygmt.datasets.load_earth_relief(resolution="15s", region=region)
pygmt.makecpt(cmap="terra", series=[-1000, 8848], output="topo.cpt")

# Plot
fig = pygmt.Figure()

with fig.subplot(nrows=1, ncols=2, figsize=["32c", "16c"], sharey="l", margins=["0.1c", "0.1c"]):
    # Observed panel (left)
    with fig.set_panel(0):
        fig.grdimage(
            grid=relief,
            shading=True,
            region=region,
            projection=proj,
            cmap="topo.cpt",
            frame=["xa", "Wse"]
        )
        fig.coast(
            region=region,
            projection=proj,
            shorelines=False,
            resolution="i",
            borders=[1, 2]
        )
        # Map scale
        fig.basemap(map_scale="JBL+o-3.7c/3.0c+w500k+f+u")

    # Modeled panel (right)
    with fig.set_panel(1):
        fig.grdimage(
            grid=relief,
            shading=True,
            region=region,
            projection=proj,
            cmap="topo.cpt",
            frame=["xa", "Wse"]
        )
        fig.coast(
            region=region,
            projection=proj,
            shorelines=False,
            resolution="i",
            borders=[1, 2]
        )
        # Map scale
        fig.basemap(map_scale="JBL+o-3.7c/3.0c+w500k+f+u")

fig.show()

