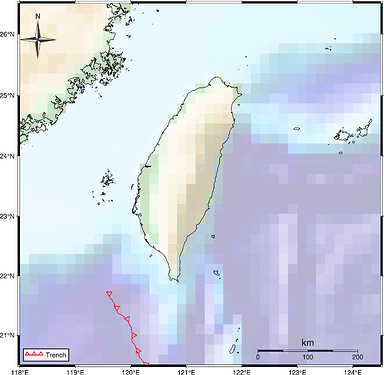
I plotted the tectonic map and put the fault (Trench). And put auto legend. This generated the symbol line with the box, not like a line with a triangle, which is the symbol I put for my trench.
Thank you.
for example, fig.plot (data= ‘Manila_Trench.dat’, pen=“0.8p,red”, style=“f1c/0.3c+l+t”, label=‘Trench’)
Hello @crystalratna,
Welcome to the GMT forum ![]() !
!
One tip for next time posting: If you provide a complete running code example (and any required data), it is easier for people to help you. You can format your script as code by placing three backticks in the line before and after the block with the script:
```
your script formated as code
```
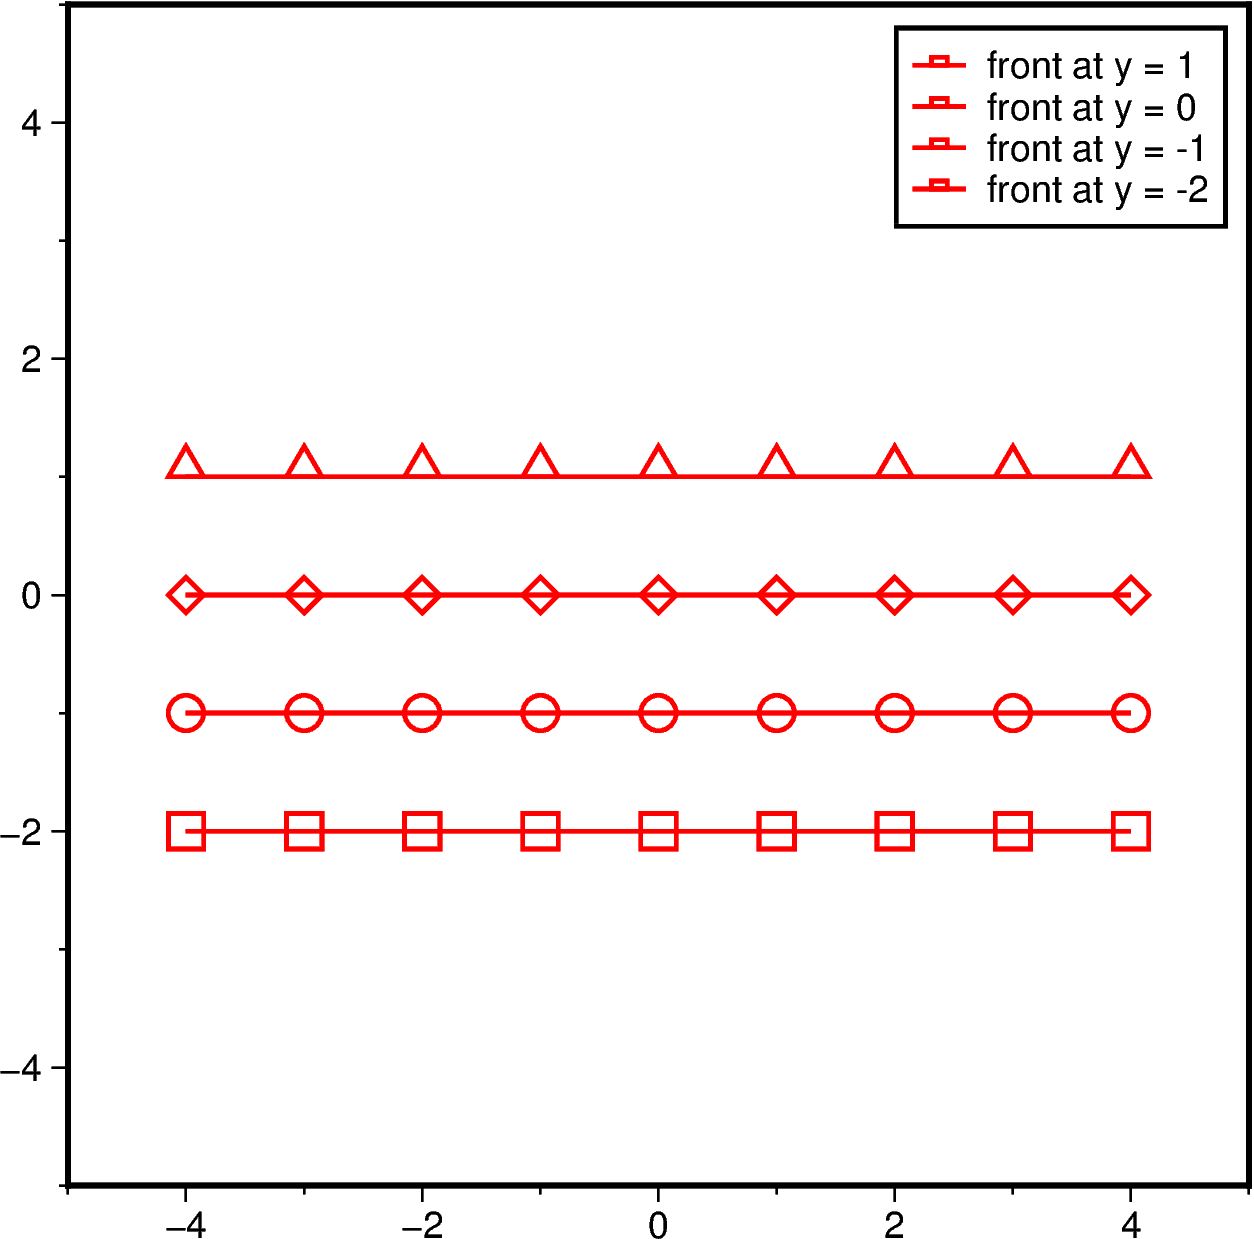
Currently, fronts are not supported by auto-legend (please see plot — GMT 6.6.0 documentation), and always the same symbol is plotted (please see the code example below).
As a workaround, you can write a GMT-specific legend file and pass it to the spec parameter of legend, please see the GMT documentation at legend — GMT 6.6.0 documentation.
import pygmt

size = 5

fig = pygmt.Figure()
fig.basemap(region=[-size, size, -size, size], projection=f"X{size*2}c", frame=True)

y = 2
for front in [
    "f1c/0.3c+l+t",
    "f1c/0.3c+t",
    "f1c/0.3c+c",
    "f1c/0.3c+b",
]:
    y = y - 1
    fig.plot(
        x=[-4, 4],
        y=[y, y],
        pen="1p,red",
        style=front,
        label=f"front at y = {y}",
    )

fig.legend()
# fig.show()
Output figure:
Hi
Sorry, it is my first time using this platform, and beginner in coding.
Thank you for your reply. And I will be careful next time and put the whole code.
Here is the code that I used.
import numpy as np
import pandas as pd
import pygmt

fig = pygmt.Figure()
region=[118, 124.50, 20.5, 26.5];
topo_data = '@earth_relief_03s'
pygmt.makecpt(
    cmap='etopo1',
    #cmap='gray',
    series='-3000/4000/1',
    continuous=True
)


fig.basemap(region=region,
            projection='M20c',
            rose="JMC+f+w2c+l,,,N+o-9/8",
            map_scale="jBL+c0+w200k+f+l+o13.2/0.65")


fig.grdimage(
    grid=topo_data,
    region=region,
    projection='M20c',
    shading=True,
    transparency=70,
    frame='a')

fig.coast(shorelines="1/0.5p",
          region= region,
          borders=1,
          frame = 'a',
         )
fig.plot(data='Manila_trench.dat',pen="0.8p,red", style="f1c/0.3c+l+t",label='Trench')
fig.legend(position='jLB+o0.2c', box='+gwhite+p1p')
fig.show()
Thank you
Sincerely
Manila_trench.dat (1.8 KB)
@crystalratna thanks for providing your code.
To include fronts in a legend one has to provide a GMT-specific legend file; using an auto-legend is not supported.
For the available legend codes please see: legend — GMT 6.6.0 documentation.
For your map, you can use this file as a starting point: legend_gmt_faults.txt (107 Bytes)
And change this lines in your code:
fig.plot(data='Manila_trench.dat',pen="0.8p,red", style="f1c/0.3c+l+t",label='Trench')
fig.legend(position='jLB+o0.2c', box='+gwhite+p1p')
to
fig.plot(data='Manila_trench.dat',pen="0.8p,red", style="f1c/0.3c+l+t")
fig.legend(spec="legend_gmt_faults.txt", position='jLB+o0.2c', box='+gwhite+p1p')
Output figure (with reduced resolution of the grid)
Hi
Thank you for being so helpful.
Sincerely

