Xyz2grd and grdimage mismatch

I have this code, where I want to use the longitude, latitude and geoidheight from my csv file.

data_file = pd.read_csv(“geoid_calc_scandinavia_test.csv”)
latitudes = data_file[“latitude”]
longitudes = data_file[“longitude”]
elevations = data_file[“geoidheight”]

grid = pygmt.xyz2grd(x=longitudes,y=latitudes ,z=elevations, spacing=(0.5, 0.5), region=[-20, 40, 55, 70])

fig = pygmt.Figure()
fig.grdimage(grid=grid)
fig.coast(shorelines=“1/0.5p”, region=[-20, 40, 55, 70], projection=“M10i”, frame=“ag”)
fig.show()

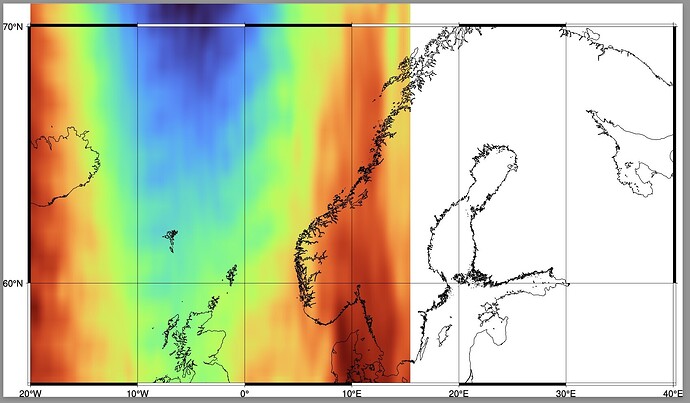
When i run this code, i get this image, which i cant get my head around why turn out like this:


I have tried shifting x and y, latitiude and longitude, but when I do that i get this error:
grdimage [ERROR]: Passing zmax <= zmin prevents automatic CPT generation!
grdimage [ERROR]: Failed to read CPT (null).

This is the file I am using:
CSV file

Anything I am misunderstanding or am I implementing it wrong? Thanks! :grinning:

Hello @gis_sebb,

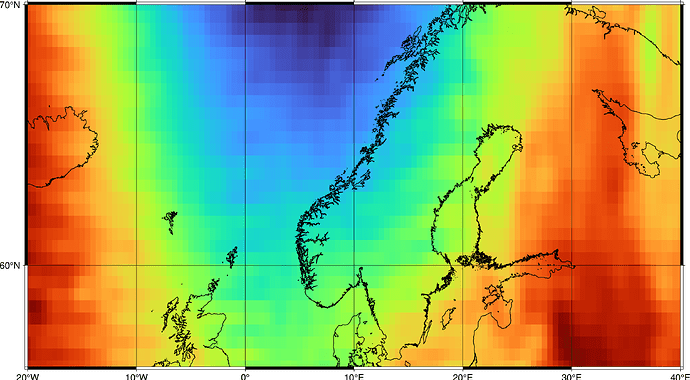
I think you have to specify the projection already within pygmt.Figure.grdimage, which is the first plotting method used for this figure. With this modification of your code, I get the output figure shown below. Does this figure match your expectation?

Code example:

import pandas as pd
import pygmt

region_sca = [-20, 40, 55, 70]

data_file = pd.read_csv("geoid_calc_scandinavia_test.csv")
latitudes = data_file["latitude"]
longitudes = data_file["longitude"]
elevations = data_file["geoidheight"]

grid = pygmt.xyz2grd(
    x=longitudes,
    y=latitudes,
    z=elevations,
    spacing=(0.5,0.5),
    region=region_sca,
)


fig = pygmt.Figure()

fig.grdimage(
    grid=grid,
    # specify projection within the first plotting method used for this figure
    projection="M10i", 
)

fig.coast(
    shorelines="1/0.5p",
    region=region_sca,
    frame="ag",
)

# fig.colorbar()

fig.show()
# fig.savefig(fname="scandinavia_geoid.png")

Output figure:

1 Like

@yvonnefroehlich This was exactly what I was looking for, thanks! Appreciate it