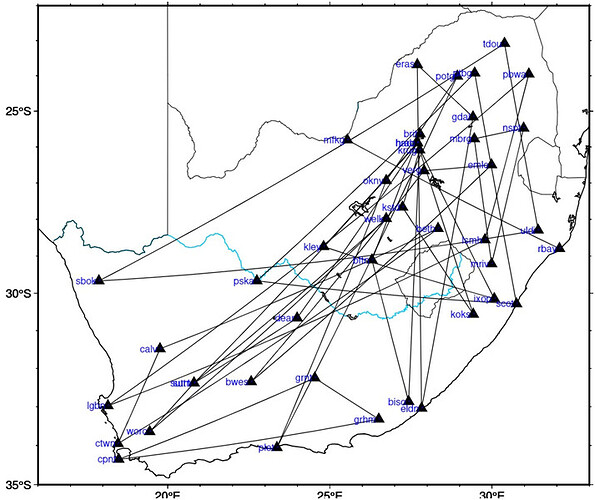
Hello everyone. I’m trying to plot a baseline connecting stations, but I’m having trouble getting the desired result. Below is the plot I generated using the code provided. I would appreciate it if you could review it and suggest any adjustments needed to achieve the desired plot.
 gmt set MAP_FRAME_TYPE plain
 gmt set FONT_LABEL 16p
 gmt makecpt -Cjet -T-15/30/2
gmt pscoast -R16/33/-35/-22 -JM20c -BWSne -Baf -I1/1p,0/200/251 -W1,black -Gwhite -Di -N2/0.25p,black -Na/0.5,black  -Swhite > SA.ps
gmt makecpt -Cblack -T-10/30 -H > my.cpt
     gmt psxy SA.dat -R16/33/-35/-22 -JM20c -BWSne -St0.5c -Cmy.cpt -Baf > map.ps
     gmt psxy SA2.dat -R16/33/-35/-22 -JM20c -BWSne -W0.8 -Fn -Cmy.cpt -Baf > map.ps
gmt velo sa2.dat -R16/33/-35/-22 -JM20c -BWSne  -L -Se0.001i/0.99+f10p -W0.30p,blue -Gblue -A0.25c+p1p+e -X0 -E -Y0>> t.ps

sa2.dat
|##Long|  Lat|        Vel_N|Vel_E|E_N|        E_E|       E_elipse|stn_name|

|20.8109|-32.3814|19.655|14.1803|0.0177083|0.044644|0.005|sutm|
|23.9926|-30.6652|18.9747|16.7209|0.0114477|0.0168333|0.005|dear|
|27.7072|-25.887 |18.4196|18.0934|0.0118431|0.018044|0.005|harb|
|25.54|-25.805 |19.845|18.1428|0.0183381|0.0207543|0.005|mfkg|
|32.0784|-28.7955|18.0075|16.62|0.0158661|0.0283594|0.005|rbay|
|17.8792|-29.6693|19.4475|17.8611|0.0128241|0.0172285|0.005|sbok|
|30.384|-23.0799|17.486|18.7653|0.0256199|0.0213807|0.005|tdou|
|31.4209|-28.2931|18.1802|16.5835|0.0123943|0.0193234|0.005|uldi|
|37.861|-46.876 |1.133|-5.5442|0.116232|0.204351|0.005|marn|
|26.2978|-29.1037|19.521|15.5682|0.157873|0.10082 |0.005|bftn|

SA.dat
|##Long|  Lat|        Vel_Up|        |
|---|---|---|---|
|20.8109|-32.3814|0.105569||
|23.9926|-30.6652|0.163773||
|27.7072|-25.887 |0.52145 ||
|25.54|-25.805 |0.446383||
|32.0784|-28.7955|-1.05978||
|17.8792|-29.6693|-0.213953||
|30.384|-23.0799|0.356411||
|31.4209|-28.2931|-1.46546||

SA2.dat
##Long	  Lat	        Vel_Up
>
20.8109	-32.3814	0.105569
23.9926	-30.6652	0.163773
27.7072	-25.887 	0.52145
>
25.54	-25.805 	0.446383
32.0784	-28.7955	-1.05978
>
17.8792	-29.6693	-0.213953
30.384	-23.0799	0.356411
31.4209	-28.2931	-1.46546
>
37.861	-46.876 	1.67982
