How do I read LRO data into GMT to plot a map?

I am trying to read this data file from the Lunar Reconnaissance orbiter to plot a map of the Lunar South pole with GMT using pygmt to interface:

https://pds-geosciences.wustl.edu/lro/lro-l-lola-3-rdr-v1/lrolol_1xxx/data/lola_gdr/polar/float_img/ldem_80s_20m_float.img

How do I do it? Ive been able to import evenly spaced latitude and longtitude coordinates with elevation values and map them but I haven’t figured out how to import this .img file that is a picture. I’ve viewed it using NASA PDS software, but I want to work with the data and preform calculations.

Any help would be appreciated, this is for a college project so if you can help ASAP that would be much appreciated.

Again all I want to do is get that data into GMT using pygmt.

PyGMT has pygmt.datasets.load_moon_relief — PyGMT which loads resampled versions of the Moon/LOLA data into an xarray.DataArray, amd you can the plot that with grdimage.

Py-aside, the answer to these type of issues almost always fall into GDAL directly.

You can convert your (HUGE grid) with grdconvert, which means that you can also use that grid directly in GMT, but mind you that’s a big beast.

This works.

grdconvert ldem_80s_20m_float.lbl -Gthis_moon.grd

I looked at this, the data is not at a very high resolution. I am trying to work with an LRO relief map that has about 20m resolution (the file in the link I sent)

I will try this. Do you mind letting me know why this is necessary to do this and why GMT can’t just read the file directly? Also, you why do I grdconvert the label file and not the image file directly?

I managed to build a grid and plot a map using a csv format file but not an image format file. Is it something I am doing wrong, or does GMT just not like .img files?

I also was not able to install GDAL on my computer since I cannot build the wheel and I would need some large microsoft program to do it. I was able to use gdal_translate to make a .tif file from the .img file I had. However, I could not get that to work with pygmt. Is there any way I can do this in the OSGeo4W shell? That is what I have installed gdal through on my computer.

You are right, you can use the moon file directly. My example was meant to show that. But mind you that you want to use PyGMT and not GMT directly and then I don’t know how to do it with PyGMT.

GMT likes everything :slight_smile: … but relies heavily on GDAL for its pleasures. Note that GDAL is a mandatory dependency of GMT so you don’t need to install anything else. You already have the GDAL engine working for you through GMT.

But the work is clearly doable. I did this with GMT.jl (low resolution image due to its original file size)

Im trying to get the file into Python since I plan to work with the data in it through there. I managed to use gdal_translate through OSGeo4W to get the .grd file. it came out as .grd.aux.xml and another file as .grd (which was the actual grid file). I still cannot get this into GMT. What do I have to pass into GMT to open this file?

I send in the file, the region the file represents as "0/360/-90/-80 of min long max long min lat max lat respectively. I also pass a projection “s0/-90/15c” for polar stereographic at 15 cm on the screen.I am using grdimage, to go from grd to image in pygmt. Anything here obviously wrong when reading the .grd file?

I pass it the .grd.aux.xml to read and it says psconvert failed? Is that something in GMT or in Python? What do I have to pass in command line to get GMT to read this .grd file?

Yes, I got that.

OK, but no need, the grdconvert example I showed do exactly the same.

Well, that gets you a netcdf file that you can easely ingest in GMT like any other grid you examples in docs.

Nope, the file has data already projected in polar stereographic and it can’t cover the full sphere.

C:\v>grdinfo pds.grd
pds.grd: Title: Produced by grdconvert
pds.grd: Command:
pds.grd: Remark:
pds.grd: Gridline node registration used [Cartesian grid]
pds.grd: Grid file format: nf = GMT netCDF format (32-bit float), CF-1.7
pds.grd: x_min: -303990 x_max: 303990 x_inc: 20 name: x n_columns: 30400
pds.grd: y_min: -303990 y_max: 303990 y_inc: 20 name: y n_rows: 30400
pds.grd: v_min: 1730.10266113 v_max: 1744.42724609 name: z
pds.grd: scale_factor: 1 add_offset: 0
pds.grd: format: netCDF-4 chunk_size: 129,129 shuffle: on deflation_level: 3
pds.grd: Default CPT:
PROJCS["unknown",
    GEOGCS["unknown",
        DATUM["unknown",
            SPHEROID["unknown",1737400,0]],
        PRIMEM["Reference meridian",0],
        UNIT["degree",0.0174532925199433,
            AUTHORITY["EPSG","9122"]]],
    PROJECTION["Polar_Stereographic"],
    PARAMETER["latitude_of_origin",-90],
    PARAMETER["central_meridian",0],
    PARAMETER["false_easting",0],
    PARAMETER["false_northing",0],
    UNIT["metre",1,
        AUTHORITY["EPSG","9001"]],
    AXIS["Easting",NORTH],
    AXIS["Northing",NORTH]]

Basically, just import the (> 3 GB) grid in PyGMT, even if you have to convert it into netCDF first (my grdconvert or your gdal_translate examples).
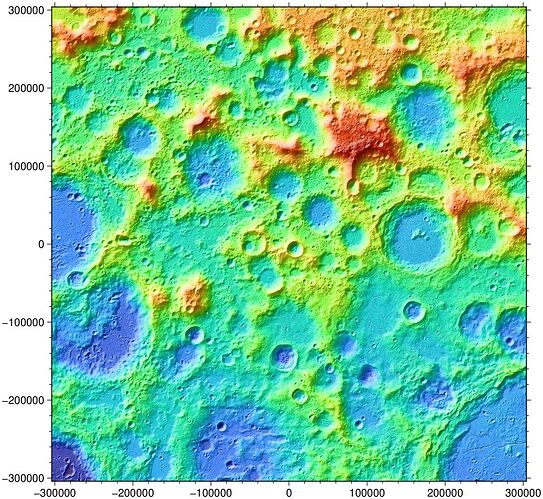
grdconvert ldem_80s_20m_float.lbl -Gthis_moon.grd

I’m not sure how to do this on my PC since I was not able to install GDAL directly, but through OSGeo4W. I tried it in there as well as in cmd prompt but it did not work.

also, importing the grid file into PyGMT is what I am having trouble with. If you could tell me how I would import this into GMT directly as I have never done that, it might help me derive a python translation for the import.

When you install PyGMT you also install GMT (the C package). You have it in your computer but Python (orr better, Conda) likes to complicate it and does not put it under direct access. Others that know more on PyGMT installation may help in this regard. It’s just a question of defining the right paths to have straight access to GMT.

Yes. I had some trouble with this and added GMT into the system path manually.

You surely have noticed that I’m always skipping the Py questions and that is because I’m not a Py user. What I’ve been answering is that you goal is for sure doable. See the PyG docs on how to import a netCDF (.grd or .nc) file and import the one obtained from conversion of the PDS file.

I’ve been trying to load it in through Python but am getting a bunch of errors. What would I type into my command window to load it in directly through GMT?

I have to repeat what I said in my previous answer. See the PyG docs. There are examples on how to use xarrays (I think) to import data into python memory and having ready to use in PyGMT.
Maybe it would help if you explain what is that you intend to do with the lunar model.

I think you might be misinterpreting what I said.

I’m asking how would I import the grid file I made without using Python, and directly through GMT in the command prompt.

I may be able to reverse engineer the Python code from the command prompt line. I spent some time messing w/ xarrays and PyGMT which wraps xarrays but to no luck.

The lunar South Pole DEM is going to be used to calculate travel time estimations around the lunar south pole when factoring into account elevation changes. That’s why I am dead set on working with a high resolution DEM in Python.

On command line we do not import a grid in the sense that we can later decide what to do with it. We do that only within a programming language. Ob CLI (command line interdface) we instruct a module (one from the GMT package) to do what it was designed to do. And there is no GMT module to do what you want to. So, I’m afraid you’ll have to load it python with the help of some other user that can help you with it.

Alright, that’s unfortunate. Thank you for clarifying that though.

I’m a couple of days late on this topic, but I might be able to help, as I’ve already done all of what the OP is asking how to do (just not in Python).

The 20m LOLA grid file is a binary file of Polar Stereographic projection topographic heights. Study the .lbl file for hints on its extent, spacing, etc.

To create a NetCDF, I did it in two steps.

Step 1 ) Convert the grid into a single column binary file. I did it with a little FORTRAN program I wrote (yes, FORTRAN!). Its fast and furious.

Step 2) Once I had the data in a single column file, then I was able to use GMT’s xyz2grd command (with the appropriate -Z option) to form a 20m resolution NetCDF file (30400x30400).

Step 3) (optional) From there, you can use grdproject to place the data on a lat/lon lattice in a new NetCDF file. You just need to watch how you interpolate.

Once you have a big LOLA DEM file set the way you need, then you can use grdcut commands to map the topography of the region you’re interested in.

Not sure how helpful any of this is for you. I’m an old GMT dinosaur and can most always apply various coding tricks to manipulate (read abuse) data to do whatever it is I need it to do.