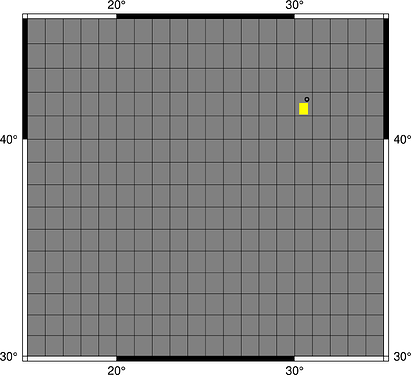
I am attempting to use blockmean to calculate the number of earthquakes and seismic moment release across a geographic region. The results look mostly reasonable, but some of the events are counted in a grid cell that they are not located within. For example, when I run the following script:
# Run blockmean
X=30.69
Y=41.70
echo $X $Y 10 | gmt blockmean -I0.5/0.5 -R15/35/30/45 -Sn -Gnum.grd

# Plot results
gmt psxy -T -K > example.ps
cat > num.cpt << EOF
0 black 1 black
1 yellow 2 yellow
B black
F yellow
EOF
gmt grdimage num.grd -JM5i -R15/35/30/45 -Cnum.cpt -K -O >> example.ps
echo $X $Y | gmt psxy -J -R -Sc0.05i -W1p -K -O >> example.ps
gmt psbasemap -J -R -Bxa10g1 -Bya10g1 -K -O >> example.ps
gmt psxy -T -O >> example.ps
gmt psconvert example.ps -Tg -A
The grid cell that this point is counted in is south of the point itself:
I would appreciate any guidance on making sure the input points are counted in the correct geographic bin. Hopefully it is something obvious I am doing wrong! Thanks!
