Lunar terrain

Hello – I am leading a research group of students seeking to model lunar terrain, starting with craters. We were made aware of pygmt, which we have successfully loaded using Anaconda. As a result we have a Jupyter notebook in which the command

import pygmt

works. Now we want to actually draw pictures and pull down lunar elevation data. We have seen

https://www.pygmt.org/latest/api/generated/pygmt.datasets.load_moon_relief.html

but my ignorance of Python is such that I need some explicit code to get us started. Grateful for any pointers!

David Calvis
Baldwin Wallace University

https://www.pygmt.org/latest/tutorials/index.html

Very cool, thank you!

An alternative lunar colour-scheme by Paul Naylor

Needs a little tweak on the low end

julia> grdimage("@moon_relief_01d", cmap="moon.cpt", figname="moon", show=1)

Hello @dcalvis,

welcome to the GMT forum :slightly_smiling_face: and great you want to use PyGMT :rocket: !

GMT provides several remote datasets (Remote datasets β€” Remote Datasets documentation), and PyGMT offers functions to load these remote datasets into a xarray.DataArray. For the luna relief, you can use pygmt.datasets.load_moon_relief β€” PyGMT.

For plotting the grid, your students can follow the PyGMT tutorial Plotting Earth relief β€” PyGMT. It is actually using the Earth relief, but it should work in the same way for the luna relief grid (there may be some differences regarding the available resolutions of the grid).

Thanks to everyone! This is very helpful!

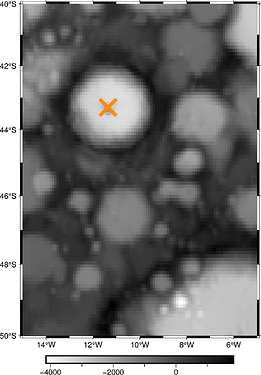
As a followup, how please could I use PyGMT to draw a beautiful, detailed gray-scale relief of the Tycho Crater, for example? I tried it using the coordinates of the crater available at Wikipedia, etc. I tried to reduce the resolution as much as possible. But it did not look good at all; in fact, I could not even recognize the crater. Again, thanks to everyone.

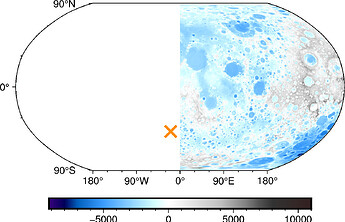
I just tried this, and I found that the lunar relief is only available for the east and west sides for resolutions 06m or lower. I did not find a note in the docs so far (will check this in more detail at a later time).

import pygmt as gmt
from pygmt.datasets import load_moon_relief

region=[-180, 180, -90, 90]
grid = load_moon_relief(region=region, resolution="06m", registration="gridline")

fig = gmt.Figure()
fig.basemap(region=region, projection="N10c", frame=True)
fig.grdimage(grid=grid, cmap="@moon_relief.cpt")
fig.colorbar(frame=True)
fig.plot(x=-11.36, y=-43.31, style="x0.5c", pen="2p,darkorange")
fig.show()

region=[-180, 180, -90, 90]
grid = load_moon_relief(region=region, resolution="05m", registration="gridline")

fig = gmt.Figure()
fig.basemap(region=region, projection="N10c", frame=True)
fig.grdimage(grid=grid, cmap="@moon_relief.cpt")
fig.colorbar(frame=True)
fig.plot(x=-11.36, y=-43.31, style="x0.5c", pen="2p,darkorange")
fig.show()

region=[-15, -5, -50, -40]
grid = load_moon_relief(region=region, resolution="06m", registration="gridline")

fig = gmt.Figure()
fig.basemap(region=region, projection="M10c", frame=True)
fig.grdimage(grid=grid, cmap="grayC")
fig.colorbar(frame=True)
fig.plot(x=-11.36, y=-43.31, style="x1c", pen="4p,darkorange")
fig.show()
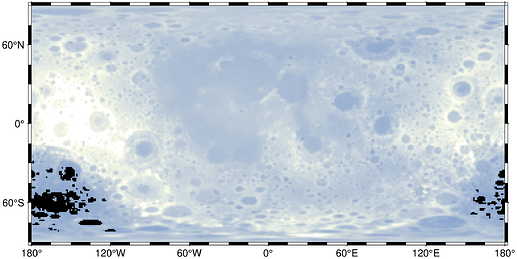
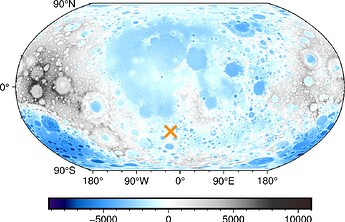
I cannot reproduce that from julia (and hence from CLI). Tried 06m, 05m and 04m and all run fine.

No half-moon issue in pygmt 0.12 after running the test in CLI

it seems CLI gmt downloads and blends two halves into one 5-min grid, the western and the eastern. While only the eastern part is present on the half-moon plot.

gmt grdimage @moon_relief_05m_g -JN10c -BWSen -Ba -C@moon_relief.cpt -png lunar_terrain
grdblend [NOTICE]: Remote data courtesy of GMT data server oceania [http://oceania.generic-mapping-tools.org]

grdblend [NOTICE]: LOLA Moon Relief at 05x05 arc minutes reduced by Gaussian Cartesian filtering (7.1 km fullwidth) [Mazarico et al., 2013].
grdblend [NOTICE]:   -> Download 180x180 degree grid tile (moon_relief_05m_g): S90W180
grdblend [NOTICE]:   -> Download 180x180 degree grid tile (moon_relief_05m_g): S90E000

Yes, I am also confused by this. Did not faced such an issue when playing with the new remote datasets some time ago. Will check this in detail later (also if there is something wrong on my side); currently busy with other tasks :slightly_smiling_face:. At least good to know that it work with the Julia wrapper.

@mkononets Under which operating system did you test it? For Linux, your code line gives my a correct plot, but under Windows I still get a plot showing only the east part.

Thank you,everyone! Regarding the resolution of the Tycho image, my hope had been that PyGMT would allow us to plot, download, and analyze elevation data for such craters at the resolution of our choice. Originally we were looking at Orbital Data Explorer - Granular Data System - LRO LOLA RDR Query Tool, but that approach would require us to store tons of data for each crater that we analyze. Also, a single query could result in 10^6 data points, way too much to fit with splines, for example. So we thought that PyGMT could be the answer to all this. However, in the case of Tycho, for example, we’d need better resolution to really dig in and start modeling the surface of the crater. I feel that if we could pull in higher resolution (but not too high!), then we would have the tool that we need. Again I am very grateful for this help.

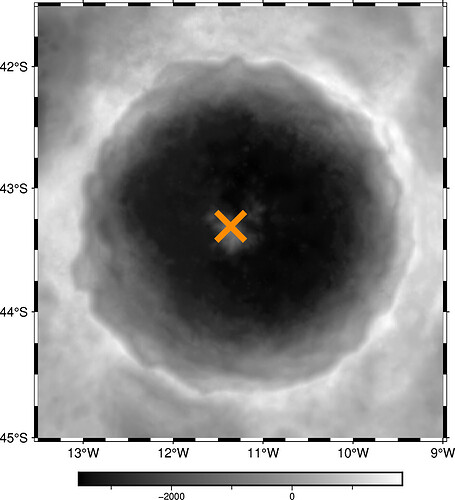
Update I was able to zoom in and apply resolution=β€œ15s”, resulting in this. Not sharp enough yet for our needs, but certainly better. Again thanks everyone.

Linux, gmt and pygmt in a conda environment.

Hello @mkononets Thanks for your contributions. Did I mention that we are running Python in Google Colab? It allows for a level of collaboration and one can install PyGMT in Colab at runtime. That said, would you suggest some other platform? Again thanks.

It will look sharper if you shade illuminate it.

Thanks @mkononets for this information.

I now tested the other planetary remote datasets (Venus, Mars, and Mercury), and there the plots are complete for resolutions equal or higher than β€œ05m”. I also figured out that it works for pixel registration, but not for gridline registration. Details see Remote dataset moon relief: Only east side is plotted for resolution >= "05m" and gridline registration Β· Issue #8580 Β· GenericMappingTools/gmt Β· GitHub.

as Joaquim pointed out, that bad grid might get stuck in the local cache

does gmt clear cache work both for CLI and for pygmt? Is there any specific mechanism for pygmt?

no suggestions on this matter, I have never really used any of these collaboration software.

So, after deleting all downloaded remote dataset data, running β€œgmt clear cache”, and restarting my laptop, it finally works correctly for me, and the moon relief is plotted completely for all resolutions and both registrations. Thanks for your suggestions and help!