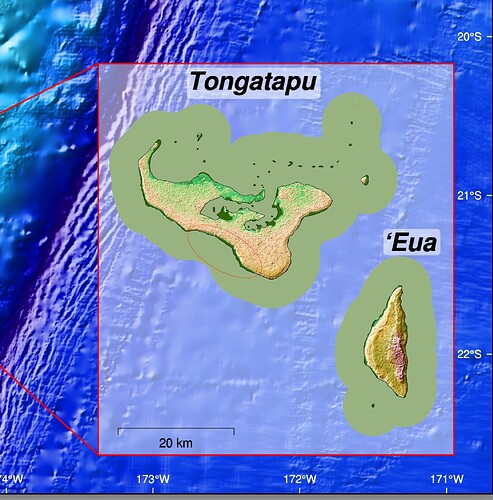
I’ve been plotting maps of small regions, and noticed the DEM data I am using do not match up exactly with the built in coastlines (e.g. gmt coast -Df ...). Here’s an example:
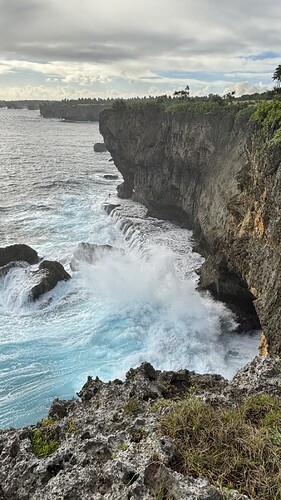
Notice the dark green areas around the coast. Now these could be genuine very low elevation locations (near to 0 m above mean sea level). But I know for a fact that there are quite precipitous cliffs along parts of the south coast of Tongatapu where there is a band of dark green (marked by the red ellipse). Here is a photograph of the area:
Initially I thought it was probably an error in the DEM. But just for interest, I decided to compare the built in GSHHG coastline with the coastline from OpenStreetMaps. Once one has downloaded the OpenStreetMap coastline (in shapefile format) and unzipped it, it can be read by GMT (provided GDAL support has been compiled in). The OpenStreetMap coastline is a huge file, and takes a long time to plot. It is easily cut down to a manageable size with GMT:
gmt gmtspatial land-polygons-complete-4326/land_polygons.shp -C -R178:30W/23S/171W/14S+r > tonga.ll
Adjust the region for your purposes.
Now we can easily compare the OpenStreetMap coastline with the GSHHG coastline built into GMT:
#!/usr/bin/env bash
#
# Compare OpenStreetMap coastline with GSHHG built into GMT.

proj="T177W/0S"
tongatapu_region="175:25W/21:33S/174:50W/20:56S"

gmt begin coast PNG,pdf
	gmt plot tonga.ll -J${proj}/25c -R${tongatapu_region}+r \
		-BWSen -Bpxfa1 -Bpyf1a1 -Wthinnest,black
	gmt coast -Df -Wthinnest,red
gmt end
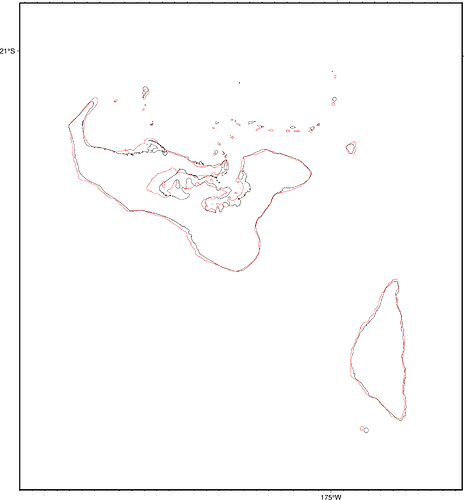
And here is the map (OpenStreetMap is black, GSHHG is red).
One can see that there are some quite large differences in the two coastlines. At least along the south coast of Tongatapu the OpenStreetMap coastline more closely matches the DEM, and what I would expect to see from actually being there.


