When shading/illuminating terrain with grdimage -I I run into the problem of the shading changing the saturation and thus the color and not just the brightness.
Additionally the shading is way too aggressive for my liking. Especially on the lighted side. I experimented quite a bit with grdgradient but that brought me nowhere. After quite a bit of unsuccessful reading in the Docs I’m turning to you for your ideas, tips and tricks.
-
What I’m trying to duplicate. It seems it is handmade with quite a bit of artistic freedom. Therefore a 1:1 copy can’t be achieved as I think there is no way how I can selectively smoothen the flatter areas where detail is not necessary for me.
-
The plain colors of my CPT
-
My CPT with -I+d. Note the greens close to the shore line which became way more saturated und the very bright (white-ish) sunny side of the summit. One can argue that Hawai’i enjoys lots of sunshine and lush vegetation but that isn’t what I’m after.
My questions:
- How to keep the colors the same and only change their brightness?
- How to do I restrict the brightness of the lit side while keeping the darkening of the unlit side the same or even increase it?
Your input is greatly appreciated.
Some code to play with:
gmt grdcut @earth_relief_03s -Ghawaii.grd -R-156.5/-154.5/18.5/20.5

gmt begin sectional png
  gmt set PS_LINE_CAP round
  gmt set PS_LINE_JOIN round
  gmt clip -R-156.5/-154.5/18.5/20.5 -Jm-155.5/1:500000 land_polygons_osm_hawaii.bf2 -bi2f -B+g232/252/254
  gmt grdimage hawaii.grd -Cfaa.cpt -I+d
  gmt grdcontour hawaii.grd -Cfaa.cpt -Wthinner,204/217/233
  gmt clip -C
  gmt plot land_polygons_osm_hawaii.bf2 -bi2f -Wthinner,7/72/135
gmt end
land_polygons_osm_hawaii.bf2.zip (104.8 KB)
faa.cpt.zip (759 Bytes)
Hi @KristofKoch, here are several suggestions for you:
- Your CPT is in RGB and has no COLOR_MODEL comment. Hence, for z-values between the CPT nodes there will be interpolation along r/g/b axes and hence subtle changes in hues. I suggest you add the comment
# COLOR_MODEL = hsv to ensure sampling that preserves hue.
- You can use grdmath if you wish to treat the sunny (positive intensities) and darker (negative intensities) separately by using logical operators like LE or GE and combine that with whatever math operator you think will help you get where you want. Of course, grdgradient can be told via -Nt or -Ne to have a max range so that you reduce the overall intensity magnitudes, but grdmath is required if you want to treat the two sides separately. There is also the option of adding more light sources in grdgradient, and you can even supply a grid of light directions that you possibly could compute from slopes etc. Or add/subtract a constant to change the ambient light. So lots of options to improve things.
- Smoothing the flatter areas to have less intensity variations: Well, that is a subjective criterion that is hard to convert to math. You could smooth your grid with grdfilter but keep output the same resolution, and use that grid to compute the intensities rather than the rougher original. That will help.
Thank you for your suggestions, @pwessel – more experimenting ahead!
Great question, Kristof! And Paul has provided an equally great answer.
Typically, in HSV mode, one runs grdgradient to create a shade file, usually using the -Nt option, and specify the shade file with -I in the grdimage command. Generally the resulting map is very pleasing, cartographically speaking. But if you’re trying to match the design of FAA charts, then Paul’s suggestions on how to tweak should suffice through trial and error.
This example does have the highlights set a bit on the high side, plus this is based on using the dem1 built-in cpt. Single source illumination is from an azimuth of 315°, using the -Nt option in grdgradient.
Hi @John_Geodesy, thank you for your explanation – I’ll have a closer look at -Nt. It sounds promising. I was experimenting with -Em135/45.
But first to the Final Frontier that are color spaces and shading. It feels more like the Abyss. I switched to HSV in the CPT and added #COLOR_MODEL=+HSV as per @pwessel’s tip. I observed only minimal differences if at all. Next step was a look at the extremes. How does an illumination at +1 and -1 look like? First no illumination at all:
Just the plain colors from the CPT. Next step: Everything at +1:
Definitely lighter than 0 but also quite colourful. On to the dark side with -1:
Darker, yes, but also very deep red and greens. I expected something like this mockup for -1:
It was created in a graphics editor by using the 0 image and adding a black layer with 33% transparency on top of the land (normal blend mode).
Side by side comparison with 0 superimposed:
For me, the left side appears to “glow” and the right side feels more like “shadow”.
What do you think? Is there a way to circumvent the color shift in GMT and get the result on the right?
Code to play with:
land_polygons_osm_hawaii.bf2.zip (104.8 KB)
faa_hsv.cpt.zip (815 Bytes)
gmt grdcut @srtm_relief_03s -Ghawaii_south.grd -R-156/-155.5/19/19.5
gmt grdgradient hawaii_south.grd -Gshading.grd -Em135/45
gmt grdmath shading.grd 1 GE = shading_0.grd
gmt grdmath shading_0.grd 1 ADD = shading_1.grd
gmt grdmath shading_1.grd -1 MUL = shading_-1.grd


gmt begin sectional_hsv_-1 png
  gmt set PS_LINE_CAP round
  gmt set PS_LINE_JOIN round
  gmt clip -R-156/-155.5/19/19.5 -Jm-155.75/1:500000 land_polygons_osm_hawaii.bf2 -bi2f -B+g232/252/254
  gmt grdimage hawaii_south.grd -Cfaa_hsv.cpt -Ishading_-1.grd
  gmt grdcontour hawaii_south.grd -Cfaa.cpt -Wthinner,204/217/233
  gmt clip -C
  gmt plot land_polygons_osm_hawaii.bf2 -bi2f -Wthinner,7/72/135 -B+t"Shading -1"
gmt end

gmt begin sectional_hsv_0 png
  gmt set PS_LINE_CAP round
  gmt set PS_LINE_JOIN round
  gmt clip -R-156/-155.5/19/19.5 -Jm-155.75/1:500000 land_polygons_osm_hawaii.bf2 -bi2f -B+g232/252/254
  gmt grdimage hawaii_south.grd -Cfaa_hsv.cpt -Ishading_0.grd
  gmt grdcontour hawaii_south.grd -Cfaa.cpt -Wthinner,204/217/233
  gmt clip -C
  gmt plot land_polygons_osm_hawaii.bf2 -bi2f -Wthinner,7/72/135 -B+t"Shading 0"
gmt end

gmt begin sectional_hsv_1 png
  gmt set PS_LINE_CAP round
  gmt set PS_LINE_JOIN round
  gmt clip -R-156/-155.5/19/19.5 -Jm-155.75/1:500000 land_polygons_osm_hawaii.bf2 -bi2f -B+g232/252/254
  gmt grdimage hawaii_south.grd -Cfaa_hsv.cpt -Ishading_1.grd
  gmt grdcontour hawaii_south.grd -Cfaa.cpt -Wthinner,204/217/233
  gmt clip -C
  gmt plot land_polygons_osm_hawaii.bf2 -bi2f -Wthinner,7/72/135 -B+t"Shading +1"
gmt end
For your experiments you may need to set
COLOR_HSV_MAX_S = 0
COLOR_HSV_MIN_V = 0
The defaults are 0.1 and 0.3 partly because printers cannot handle the full gamut, but for digital you may use those 0,0. I do that for animations etc.
gmt math RGB2HSV can be used to test color conversions. For a given h,s,v the shading only messes with s,v leaving h along, then converts back to rgb. So the hue should stay unchanged by any shading. I am not sure how that comparsed to “adding black” and what that does to h,s,v.
WIth all those COLOR_HSV_* settings pure 0 or 1, your washed out plot should be all white since all hsv values converted with an intensity of +1 will give white. Likewise, your -1 will give pure black. Again, the default limits on these in GMT just puts some brakes on the illumination effects but leaves hue alone.
Hi @pwessel, thank you for your explanation. After further reading and experimentation it became clear that the interpolation for negative intensities towards Smin and Vmin leads to a saturation increase for colors with S < 1.
(Image taken from the CookBook)
S is altered instead of only changing V to a lower value. This explains why my light green colors become so saturated with negative intensities. Keeping S constant for negative intensities might be the key to my “I just want to add black”. For positive intensities I found interpolating towards Smax and Vmax quite pleasing.
Is there a way to keep S constant for negative intensities while keeping the default behaviour for positive intensities?
Ok got some steps closer … setting Smin and Vmin to zero, all negative intensities keep a constant saturation during interpolation. By compressing the range of the lighting intensity with grdmdath (in this case from -0.6 to +0.1) I avoid the very dark colors as well as the default increase in saturation.
Not yet where I want to be but coming closer …
Since I’m adding tons of GDAL kg to GMT Julia I implemented also the shading method pointed out by @Andreas in this post. The GDAL method (from the scarce references found in internet that mostly say use a photoshop type to blend color plus shade) does not change the color space and put illumination in Saturation/Value but blends the color image + shade. This blending can apparently take several forms. Anyway, as mentioned I implemented the equation shown by Andreas.
Ofc, in Julia everything seems insultingly simple (the CPT is the one you provided) and the result is interesting
grdcut("@srtm_relief_03s", R=(-156,-155.5,19,19.5), save="hawaii_south.grd");
I = gdalshade("hawaii_south.grd", color="faa.cpt", zfactor=4);
imshow(I, coast=true, fmt=:png)
Hi @joaquim, this looks very promising! I’ll give it a try later …
On my quest for beautiful hill shading I stumbled over the work of Leland Brown who developed something he calls “texture shading”.
From his 2014 Texture Shading Presentation:
What Texture Shading Does
- Two intuitive descriptions:
- A type of high-pass filter, or sharpening filter, on the DEM
- Enhances narrow terrain features (details)
- Attenuates wide features (major landforms)
- A measure of relative height compared to nearby terrain
- Light areas are higher than nearby terrain (ridges, peaks)
- Dark areas are lower than nearby terrain (canyons, valleys)
- Mathematical description:
- “Fractional Laplacian” operator
- Related to fractals, which accounts for the multi-scale properties
- At 200%, becomes an ordinary Laplacian (used in image processing)
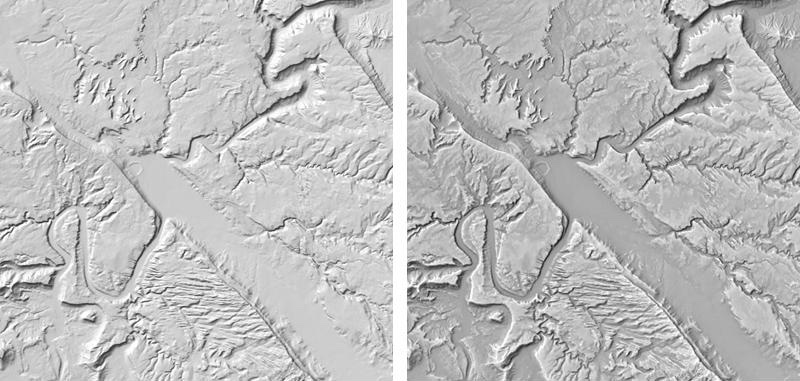
DEM
(left) and texture shading
(right) comparison
(Image source)
The usual hill shading
(left) and hill shading merged with texture shading
(right) (Image source)
I found that his texture shading technique solved quite a few of my problems, for example showing terrain features on the sunlit side and removing too heavily accented smaller details present with the usual hill shading.
Combined with the well known hill shading it makes for some very pleasing maps. As the FAA charts I’m trying to emulate feature hand drawn hill shading I certainly can’t emulate them perfectly. But that texture shading technique comes pretty close to the artwork.
Leland Brown made a lot of information – including source code – available for download. He also published a paper on it: Texture Shading: A New Technique For Depicting Terrain Relief (not included in the above-mentioned downloadable archive).
Maybe it is an idea worth a GMT feature request? Your thoughts?
Yes, that looks very nice but probably not obvious to port the code. And since it seems to use FFTs that means the method cannot be applied to grids with NaNs, at least not without some trickery.
Six years ago we had another discussion like this on different shading methods
http://gmt.soest.hawaii.edu/boards/1/topics/1041
Hi @Joaquim, multi direction hill shading can be done out of the box with GMT – unfortunately it is not really comparable to texture shading. Tried this one already (144 calls to grdgradient for one plot …).
@KristofKoch This looks vey interesting. Do you have a handy on-liner how to apply this on an input grid?
I’ve downloaded the code and should browse through it (“RTFM”) - for a quick test though, it would be super nice. If possible.
Hi @Andreas, I was unable to build from source (most probably due to lack of experience/knowledge on my part). Mr. Brown made-ready-to-use programs for MacOS and Windows available as well, that’s what I’m using.
It’s not that difficult (after all I got it to work). The User-Guide page 2 has all the steps (with commands to copy&paste) to get you up and running. Way easier than me reproducing it here. (Sorry, you have to RTFM  )
)
Basically
-
gmt grdcut – get the area of interest
-
gdal_translate – get it into a digestible format
-
texture – calculate texture data
-
texture_image – select contrast and generate image
If you used the supplied demo dataset then the gmt grdcut step can be omitted.
@KristofKoch Thank you!
I’m on Linux, so I could not used the precompiled binaries. The instructions given in the User Guide didn’t work for me. Some googling and I found out that you have to include -lm (tell gcc to link with the math library) in the two latter commands:
gcc -O2 -funroll-loops -DNOMAIN -c *.c
gcc -O2 -funroll-loops *.o texture.c -o texture -lm
gcc -O2 -funroll-loops *.o texture_image.c -o texture_image -lm
Then I was able to compile and run texture and texture_image.
The results are very interesting. I’ll be playing more with this.
Thanks again for sharing!
@Andreas thank you for sharing that -lm info – now it runs on my Linux box as well. No more copying files between machines … awesome!
@Joaquim would you mind elaborating how the two steps can be collapsed into a pure GMT solution?
See https://docs.generic-mapping-tools.org/dev/cookbook/features.html#grid-file-format
It should be something like grdcut ... -Gfile.flt=gd:AIG though I’m not sure on the format driver name. Ans maybe you don’t even need the :AIG bit since GDAL now recognize formats by extension.