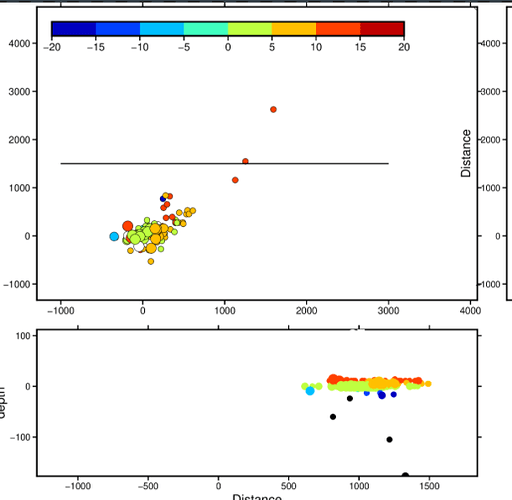
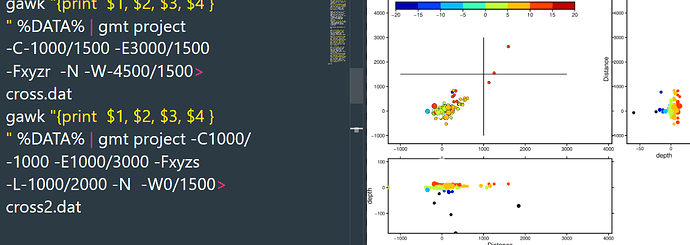
Using project in cartesian coordinate

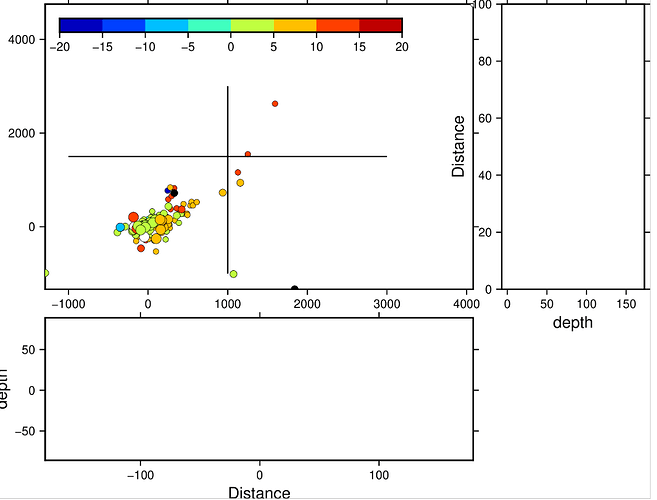
hi,how to use project in cartesian coordinate that value is NaN in the output file?
the file usgs_cat2005test1.dat is latitude and longitude coordinates and the raw data is three zone geodetic coordinates.
usgs_cat2005test.dat is cartesian coordinate format used in the following script.
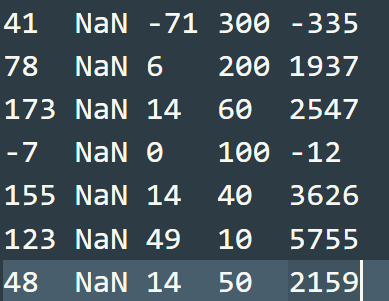
~EKO4J21AC5)4MS)4UP_{U

set R=-R-1292/4083/-1335/4755
set J=-JX15c/10c 
set DATA=usgs_cat2005test.dat

gmt begin profile png
    gmt makecpt -Cjet -T-20/20/5
    gawk "{if($4<100) print $1, $2, $3 }" %DATA% |gmt plot %R% %J% -Sc0.2 -C -Wthinnest -Ba -BWSne
    gawk "{if(($4<500)&&($4>=100)) print  $1, $2, $3 }" %DATA% |gmt plot -Sc0.25 -C -Wthinnest
    gawk "{if(($4<1000)&&($4>=500)) print  $1, $2, $3 }" %DATA% |gmt plot -Sc0.3 -C -Wthinnest
    gawk "{if(($4>=1000)) print  $1, $2, $3 }" %DATA% |gmt plot -Sc0.35 -C -Wthinnest
  
    (echo -1000 1500 & echo 3000 1500)|gmt plot -W1p,black
    (echo 1000 -1000 & echo 1000 3000)|gmt plot -W1p,black
    gawk "{print  $1, $2, $3, $4 }" %DATA% | gmt project -C-1000/1500 -E3000/1500 -Fxyzq -Lw -N> cross.dat
    gawk "{print  $1, $2, $3, $4 }" %DATA% | gmt project -C1000/-1000 -E1000/3000 -Fxyzq -Lw -N> cross2.dat

    gmt psscale -DjTL+h+o0.2i -C -B5
   
    gawk "{if($4<100) print $5, $3, $3 }" cross.dat | gmt plot -R-180/179/-86/89 -JX15c/5c -BWSne -Bxa+lDistance -Bya+ldepth -Sc0.2 -C -Y-6c
    gawk "{if(($4<500)&&($4>=100)) print $5, $3, $3 }" cross.dat | gmt plot  -Sc0.25 -C
    gawk "{if(($4<1000)&&($4>=500)) print $5, $3, $3}" cross.dat | gmt plot  -Sc0.3 -C
    gawk "{if(($4>=1000)) print $5, $3, $3}" cross.dat | gmt plot  -Sc0.35 -C

    gawk "{if($4<100) print $3,$5, $3 }" cross2.dat | gmt plot -R-7/173/0/100 -JX5c/10c -BWSne -Bya+lDistance -Bxa+ldepth -Sc0.2 -C -Y6c -X16c
    gawk "{if(($4<500)&&($4>=100)) print $3, $5, $3 }" cross2.dat | gmt plot  -Sc0.25 -C
    gawk "{if(($4<1000)&&($4>=500)) print  $3,$5,  $3}" cross2.dat | gmt plot  -Sc0.3 -C
    gawk "{if(($4>=1000)) print  $3, $5, $3}" cross2.dat | gmt plot  -Sc0.35 -C
gmt end show

usgs_cat2005test.dat (3.3 KB) usgs_cat2005test1.dat (8.3 KB)
If your data is latitude, longitude then you will need to use -: since GMT expects lon, lat.

I want to use cartesian coordinate data with -N but the output file have NaN value.

I tried to run both your gawk | project commands and I do not get any NaNs. However, I only get 3 output columns but there should be 4 I think, so something is not working right.

project [WARNING]: Column selected for latitude-formatting has values that exceed +/- 90; set to NaN
Is project command not suitable for cartesian coordinate?

What GMT version is this? (gmt --version). There are two gmt project calls in your script, do they both give you that warning about latitude-formatting?

Also, I am not sure I understand what you want. You say you have Cartesian coordinates and you want to run project, but then the output from project (cross.dat) is being plotted with what looks like a geographic region (-R-180/179/-86/89) and a Cartesian scaling. If x and y are actually longitude and latitude, what is up with the Cartesian treatment? And if they are not, is it just coincidental that you are using a -R that looks like it is geographic degrees?

hi pwessel,I use gmt6.1.0 and yes,both warning.
Just simple that I have data with Cartesian coordinates named usgs_cat2005test.dat which I want to use project to plot the projection points which fall into the line certain distance.
What’s wrong with the script that turn out that warning?and why the script you use and other also have only three row data output with -Fxyzq?

I think the warning got fixed in master after 6.1.0. As for 3 output columns: I will need to debug - should be four as requested I think.

Last question: Both project command ends up giving you NaN, yes?

I was told that I should convert the data from Cartesian coordinates to latitude and longitude coordinates before.
Yes,both project command ends up giving NaN.

Thanks, I have fixed the bug in master. The bug fix will be included in 6.2.0.

1 Like


q seems to give not the vertical distance, but the horizontal distance from the starting point.

From these screenshots, the vertical distance of (0, 0) to the section line should be 1500, and the distance x from the starting point of the section line should be 1000, but the output q of our - fxyzqp is 1000, and P is 1500.

The result I want is the plane projection within a certain range of the left and right or up and down of the measuring line, or the oblique two sides.

The updated script is as following.

set R=-R-1292/4083/-1335/4755

set J=-JX15c/10c

set DATA=usgs_cat2005test.dat

gmt begin profile png

gmt makecpt -Cjet -T-20/20/5

gawk "{if($4<100) print $1, $2, $3 }" %DATA% |gmt plot %R% %J% -Sc0.2 -C -Wthinnest -Ba -BWSne

gawk "{if((4755<500)&&($4>=100)) print  $1, $2, $3 }" %DATA% |gmt plot -Sc0.25 -C -Wthinnest

gawk "{if(($4<1000)&&($4>=500)) print  $1, $2, $3 }" %DATA% |gmt plot -Sc0.3 -C -Wthinnest

gawk "{if(($4>=1000)) print  $1, $2, $3 }" %DATA% |gmt plot -Sc0.35 -C -Wthinnest

(echo -1000 1500 & echo 3000 1500)|gmt plot -W1p,black

rem (echo 1000 -1000 & echo 1000 3000)|gmt plot -W1p,black

gawk "{print  $1, $2, $3, $4 }" %DATA% | gmt project -C-1000/1500 -E3000/1500 -Fxyzqp  -N -W0/1500> cross.dat

gawk "{print  $1, $2, $3, $4 }" %DATA% | gmt project -C1000/-1000 -E1000/3000 -Fxyzq -L-1000/2000 -N  -W0/1500> cross2.dat


gmt psscale -DjTL+h+o0.2i -C -B5


gawk "{if($4<100) print $5, $3, $3 }" cross.dat | gmt plot -R-1292/1841/-177/112 -JX15c/5c -BWSne -Bxa+lDistance -Bya+ldepth -Sc0.2 -C -Y-6c

gawk "{if(($4<500)&&($4>=100)) print $5, $3, $3 }" cross.dat | gmt plot  -Sc0.25 -C

gawk "{if(($4<1000)&&($4>=500)) print $5, $3, $3}" cross.dat | gmt plot  -Sc0.3 -C

gawk "{if(($4>=1000)) print $5, $3, $3}" cross.dat | gmt plot  -Sc0.35 -C

gawk "{if($4<100) print $3,$5, $3 }" cross2.dat | gmt plot -R-71/49/-1335/4755 -JX5c/10c -BWSne -Bya+lDistance -Bxa+ldepth -Sc0.2 -C -Y6c -X16c

gawk "{if(($4<500)&&($4>=100)) print $3, $5, $3 }" cross2.dat | gmt plot  -Sc0.25 -C

gawk "{if(($4<1000)&&($4>=500)) print  $3,$5,  $3}" cross2.dat | gmt plot  -Sc0.3 -C

gawk "{if(($4>=1000)) print  $3, $5, $3}" cross2.dat | gmt plot  -Sc0.35 -C

gmt end

The data are microseismic events with the ordered format: x y z magnitude.

Thanks for pointing out this issue. We have fixed the problem with p and q for Cartesian coordinates in the source code (see https://github.com/GenericMappingTools/gmt/pull/5231). You can follow the building instructions (https://github.com/GenericMappingTools/gmt/blob/master/BUILDING.md) if you want to try out the fix immediately, otherwise it will be included in the upcoming 6.2 release.


It seems OK but few of except event points in the bellow figure.

Can you provide more explanation? Do you think there is an error in your figure?

1 Like