Xyz2grid latitude/longitude definitions & choosing the number of levels in grd2cpt

Hey everyone!
First off, thank you for all help, I really appreciate everyone who takes time off their own work to help others. My problem is the following:

I am currently trying to create a series of maps for a presentation and have run into a series of issues in getting them to look the way I want.
My dataset consists of >19k rows, with a latitude value, longitude value, and then some variables of interest that I want to graph/map. For the purpose of this example, let’s just assume that the dataset only has three columns: latitude, longitude, and pre-industrial temperature.

The two main issues I have are as follows:
I run the following code to create a map

preindT_grd = xyz2grd(preindT_df, region=(-180, 180, -60, 83), spacing=(1.0, 1.0))
C = grd2cpt(preindT_grd, cmap=:polar);
grdimage(preindT_grd, proj=:Miller, cmap=C, title = "Pre-Industrial Temperature Distribution", xaxis=(annot=60, ticks=60), yaxis=(annot=20, ticks=20))
colorbar!(C=C,frame=(annot=:5));
coast!(region=(-180, 180, -60, 83), water="lightblue", proj=:Miller, savefig ="preindustrial_temperature.jpg")

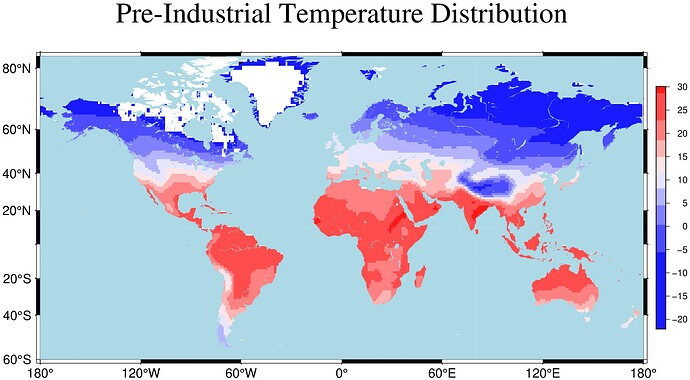
which looks as follows:

My data only covers areas with economic activity, so the NaN values (white squares) in the center of Greenland are expected. However, there are a number of regions (such as Brittany in Western France) where I definitely have data. I think this has to do with how I have defined the grid when I created my dataset.

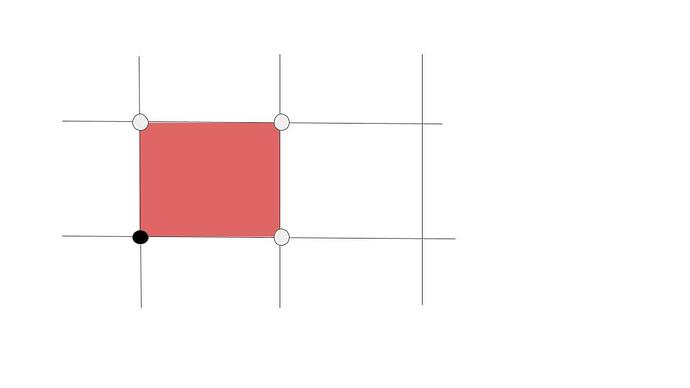
In my dataset, every row represents a 1° x 1° area. The latitude/longitude data I have tells me the coordinates of the lower left-hand corner of that area. So, the row with latitude/longitude values 48/2 gives data for the region between 48 and 49° latitude and 2 to 3° longitude. I am guessing that this is not the input that xyz2grid expects to create a grid. How can I either transform my data set to match the way that xyz2grid defines longitude and latitude or change the function call? And would this eliminate the “wrong” whitespaces I have on the map, especially around some of the coastal regions.

The second thing I would like to do is increase the number of bins that grd2cpt creates. When I change my code to:

C = grd2cpt(preindT_grd, cmap=:polar, nlevels = 128);

This changes the number of bins, but they are now equidistant, not binned so that every bin has the same number of values. For temperature, this is fine but some of my other variables have a significantly more uneven range. How would I tell grd2cpt to use more bins while still making them equally sized?

Thank you again for your help and I apologize if any of this is trivial.

Best,
Henri
I don’t think there is anything wrong in your image. Your T data is lon/lat (not lat/lon) and, from your description it contains grid registered data (See 4. Standardized command line options — GMT 6.6.0 documentation).

There is non-NaN colors over Brittany and West France. The white pixels you are seeing on the shores are due to the fact that the coastlines have a much higher resolution than the grid, and since you didn’t ask to paint the land it got the default white color of the paper background color that is also white.

Regarding the colormap, grd2cpt creates histogram equalized cmap. If you want a linear map, use makecpt (though grd2cpt also has an option to create linear cmaps but don’t remember right now which option it is)

Funny, I never thought on that but it’s right that users may make that confusion. When used in a nested way, it’s not supposed to use bang (!) versions of the nested calls. That is, the normal is to do

grdimage(preindT_grd, proj=:Miller, cmap=C, title = "Pre-Industrial Temperature Distribution", xaxis=(annot=60, ticks=60), yaxis=(annot=20, ticks=20))
colorbar(C=C,frame=(annot=:5));

When appending to an existing fig and neither region or proj changes, there is no need repeat them. It gets simpler if one writes only:

coast!(water="lightblue", savefig ="preindustrial_temperature.jpg")

Hey Joacquim,
thank you for your response. After more careful inspection, I definitely have data on the shore where the white pixels are, but the registration I am using is not quite grid registration (as shown in your link), it’s something in between grid and pixel registration, so the program thinks I do not have data there. Pardon my terrible Paint skills, but my data works as shown below (I am trying to imitate the image in 4.22.2 of the Standardized Command Line Options).

The black dot represents the lon/lat data point I am calling and red the area that I want to have the z-value in my data frame. I think that shifting the lon/lat in my dataset by 0.5 degrees north and east respectively, and using pixel registration (this would shift the black dot to the middle of the square) could help, right? How would I go about changing the registration type in xyz2grd? I cannot find an option for changing the registration type in from grid to pixel registration in the xyz2grd documentation

Regarding the colormap, I understand that grd2cpt creates a histogram equalized cmap. Currently, my cmap has 10 distinct colors / bins. How can I make it so that grd2cpt uses more colors / more bins so that I can show more variation? For example, each of the 10 colors in the cmap would have 10 “sub-shades” (not sure how to call this), which would then allow me to show variation between 100 different bins, not just 10.

Lastly, regarding the bang (!).

grdimage(preindT_grd, proj=:Miller, cmap=C, title = "Pre-Industrial Temperature Distribution", xaxis=(annot=60, ticks=60), yaxis=(annot=20, ticks=20))
colorbar(C=C,frame=(annot=:5));

For some reason, removing the bang after colorbar gives me an error when I run the code. I get the following message:

psscale [ERROR]: Option -DJ requires the -R option
ERROR: Something went wrong when calling the module. GMT error number = 72

It’s very possible this is something about the way I installed GMT. Please let me know if something is not clear.
As always, I appreciate your time.
Best,
H

I’ve been extremely successful at reading documentation for some users recently. Today seems no exception:

  • r or reg or registration : – reg=:p | reg=:g
    Select gridline or pixel node registration. Used only when output is a grid. More at

not sure why there is a colon : in front of p or g. Not a Julia user unfortunately.

1 Like

Other than what @mkononets already showed you, I spotted a couple other issues.

First, it was not fatal but you should not use the spacing option to xyz2grd. The reason is that that program is a reformatter , not an interpolator. Ir scans the data and finds automatically the data spacing, which must be constant (I see that I miss to warn that that option was not used)

The bang (again). Only now I say the syntax error and I’m surprised that it even worked. This:
colorbar!(C=C,frame=(annot=:5)) or this colorbar(C=C,frame=(annot=:5))
are both invalid syntax. Odd that only the second gave an error. The correct form is a kwarg, a keyword=val option, so it should be

``colorbar=(C=C,frame=(annot=:5))``

and we can even drop the C=C because at that stage it already knows the color map in use.

(sorry, see EDIT at the end of this post)

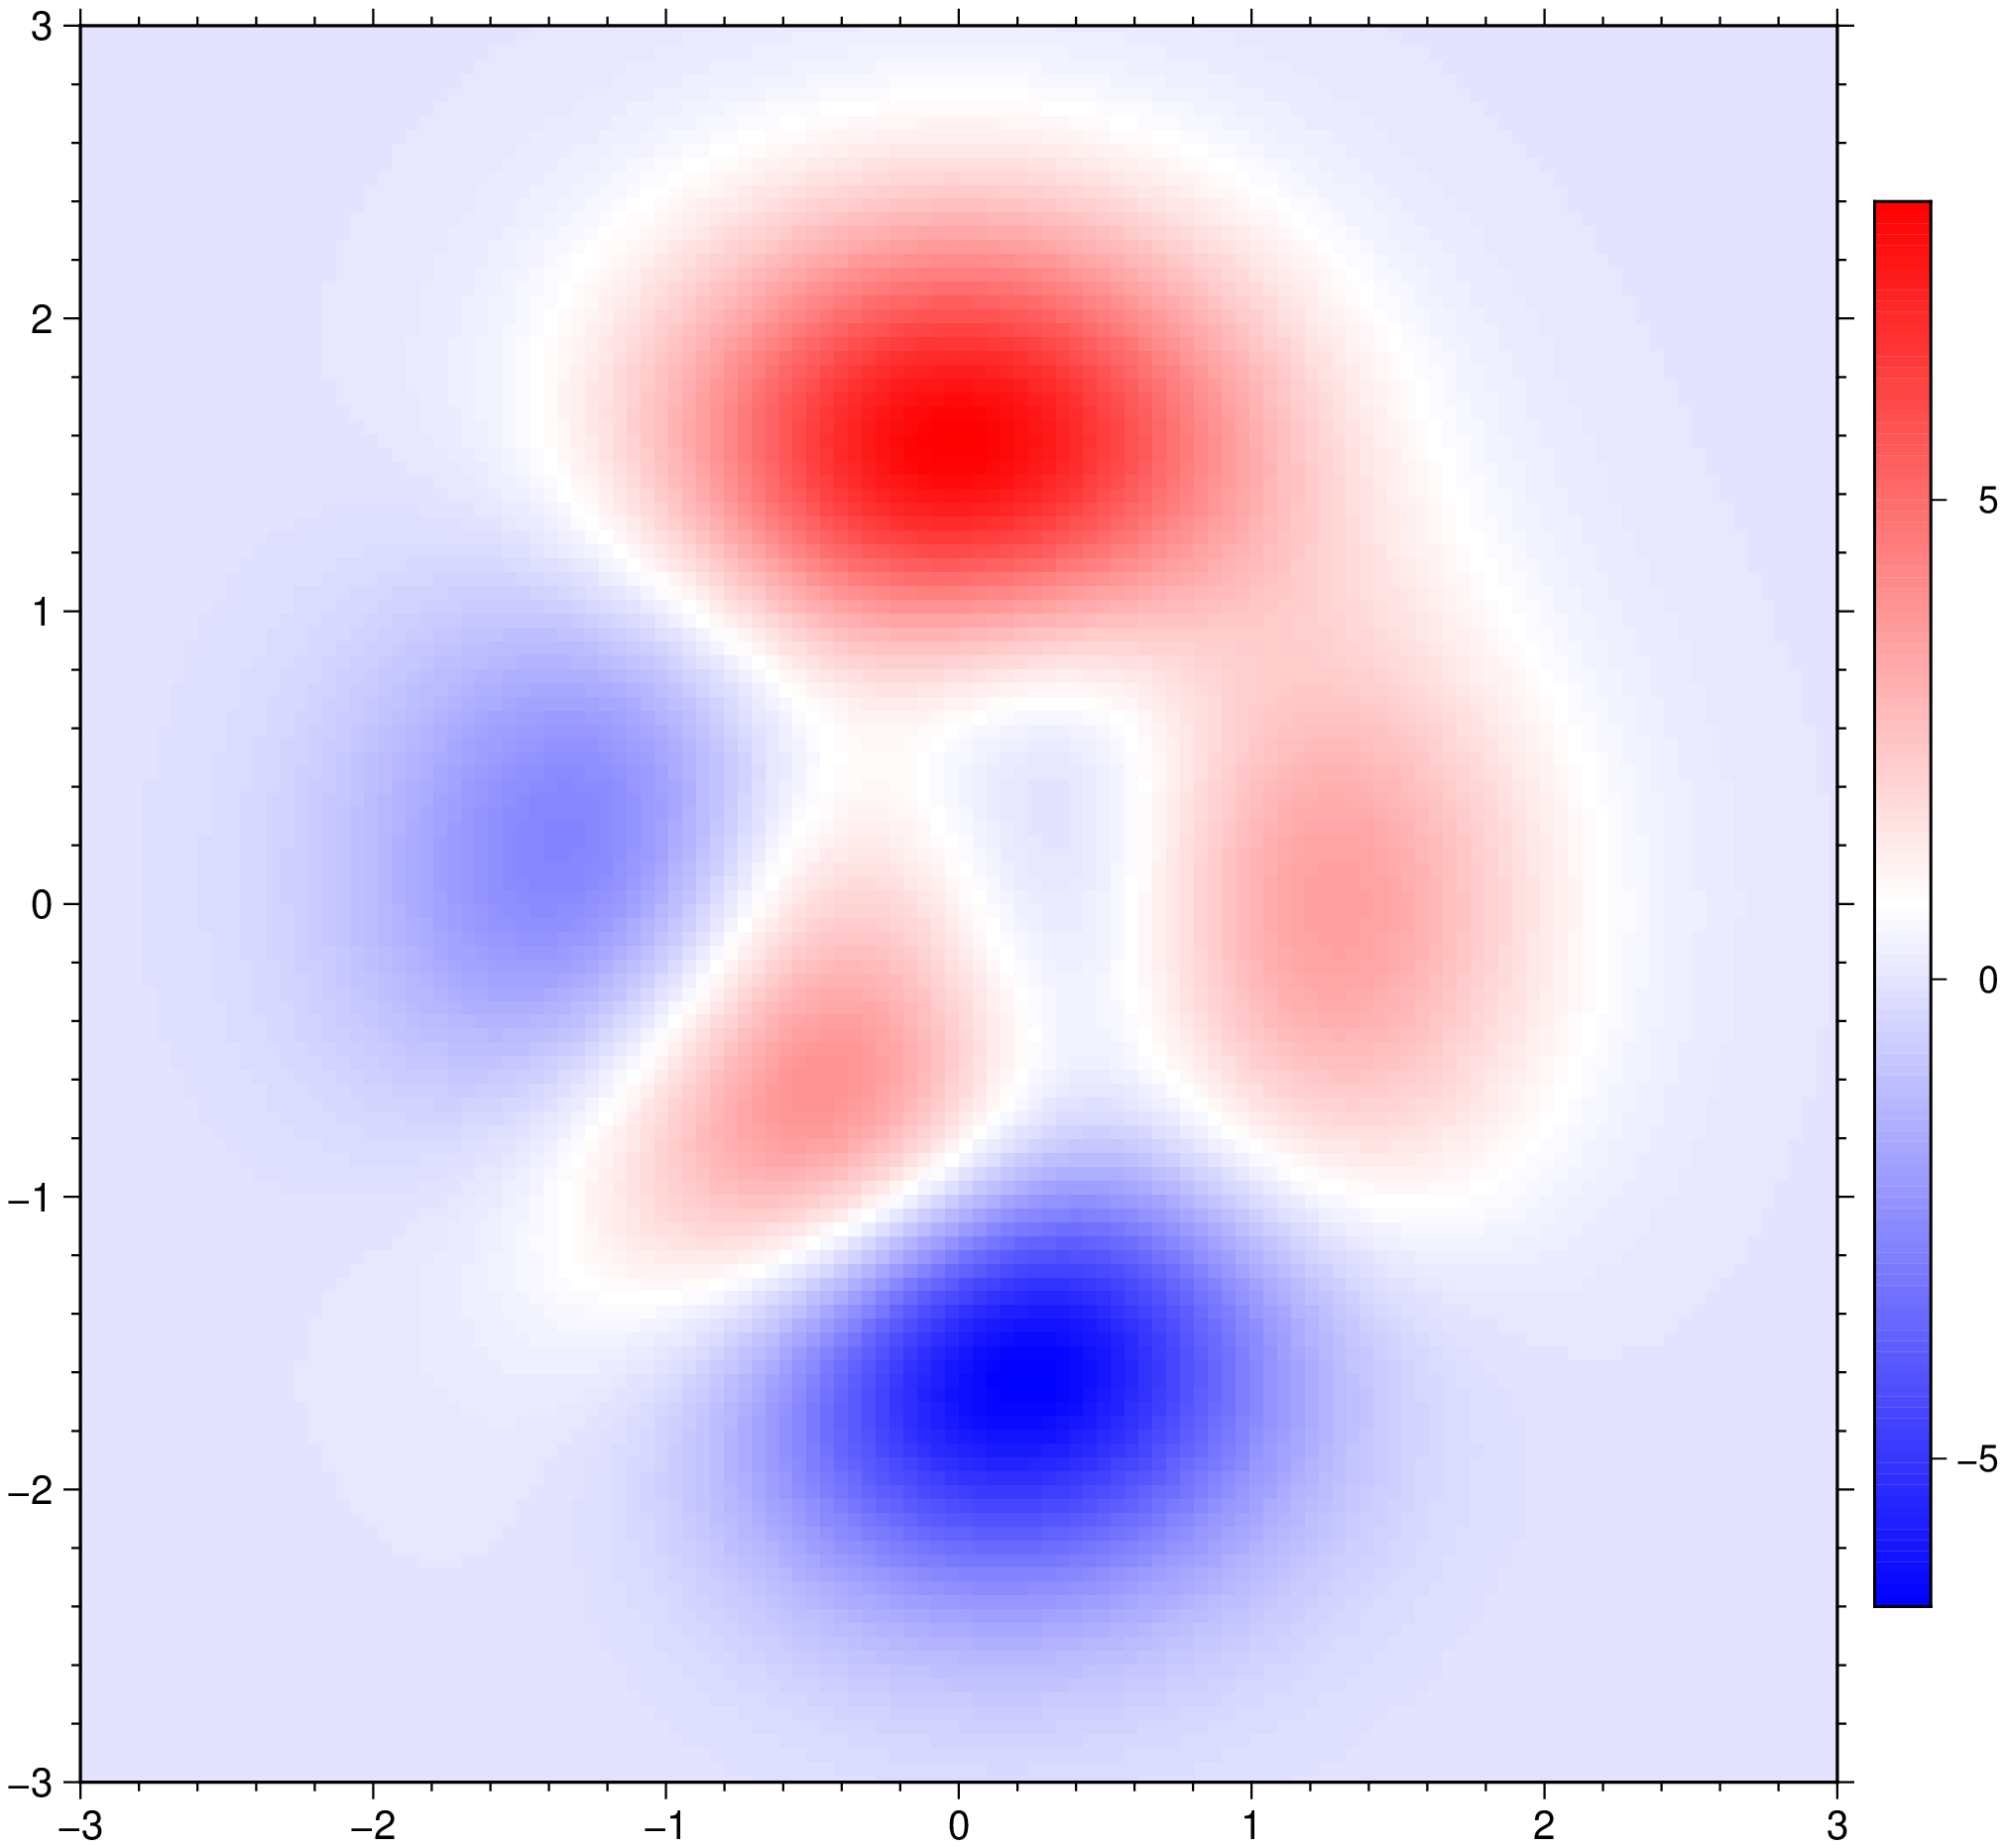
The colormap. The nlevels = 128 set 127 intervals. See this synthetic example.

G = peaks(N=128);
C = grd2cpt(G, cmap=:polar, nlevels = 128)
Extract of a GMTcpt exposed as a GMTdataset for display.
Model: rgb
Color depth: 24

127×9 GMTdataset{Float64, 2}
 Row │    r1    g1     b1     r2    g2     b2  alpha        z1        z2
─────┼───────────────────────────────────────────────────────────────────
   1 │   2.0   2.0  255.0    2.0   2.0  255.0    0.0  -6.54338  -6.42796
   2 │   6.0   6.0  255.0    6.0   6.0  255.0    0.0  -6.42796  -6.31254
   3 │  10.0  10.0  255.0   10.0  10.0  255.0    0.0  -6.31254  -6.19712
   4 │  14.0  14.0  255.0   14.0  14.0  255.0    0.0  -6.19712  -6.0817
   5 │  18.0  18.0  255.0   18.0  18.0  255.0    0.0  -6.0817   -5.96628
   6 │  22.0  22.0  255.0   22.0  22.0  255.0    0.0  -5.96628  -5.85086
   7 │  26.0  26.0  255.0   26.0  26.0  255.0    0.0  -5.85086  -5.73544
   8 │  30.0  30.0  255.0   30.0  30.0  255.0    0.0  -5.73544  -5.62002
   9 │  34.0  34.0  255.0   34.0  34.0  255.0    0.0  -5.62002  -5.5046
  10 │  38.0  38.0  255.0   38.0  38.0  255.0    0.0  -5.5046   -5.38917
  11 │  42.0  42.0  255.0   42.0  42.0  255.0    0.0  -5.38917  -5.27375
  12 │  46.0  46.0  255.0   46.0  46.0  255.0    0.0  -5.27375  -5.15833
  13 │  50.0  50.0  255.0   50.0  50.0  255.0    0.0  -5.15833  -5.04291
  14 │  54.0  54.0  255.0   54.0  54.0  255.0    0.0  -5.04291  -4.92749
  ⋮  │   ⋮     ⋮      ⋮      ⋮     ⋮      ⋮      ⋮       ⋮         ⋮
 114 │ 255.0  54.0   54.0  255.0  54.0   54.0    0.0   6.49912   6.61454
 115 │ 255.0  50.0   50.0  255.0  50.0   50.0    0.0   6.61454   6.72996
 116 │ 255.0  46.0   46.0  255.0  46.0   46.0    0.0   6.72996   6.84538
 117 │ 255.0  42.0   42.0  255.0  42.0   42.0    0.0   6.84538   6.9608
 118 │ 255.0  38.0   38.0  255.0  38.0   38.0    0.0   6.9608    7.07622
 119 │ 255.0  34.0   34.0  255.0  34.0   34.0    0.0   7.07622   7.19164
 120 │ 255.0  30.0   30.0  255.0  30.0   30.0    0.0   7.19164   7.30706
 121 │ 255.0  26.0   26.0  255.0  26.0   26.0    0.0   7.30706   7.42248
 122 │ 255.0  22.0   22.0  255.0  22.0   22.0    0.0   7.42248   7.5379
 123 │ 255.0  18.0   18.0  255.0  18.0   18.0    0.0   7.5379    7.65332
 124 │ 255.0  14.0   14.0  255.0  14.0   14.0    0.0   7.65332   7.76874
 125 │ 255.0  10.0   10.0  255.0  10.0   10.0    0.0   7.76874   7.88416
 126 │ 255.0   6.0    6.0  255.0   6.0    6.0    0.0   7.88416   7.99958
 127 │ 255.0   2.0    2.0  255.0   2.0    2.0    0.0   7.99958   8.115
                                                          99 rows omitted

and now, all together

grdimage(G, C=C, colorbar=(frame=(annot=:5),), show=true)

EDIT: Sorry, I’m not looking things carefully enough. Yes, your commands with the colorbar! is correct because you had two commands. And mine is correct too, when we use a single nested call.

And one more. I see that GMT’s xyz2grd has a -I (spacing in GMT.jl) option but I’m confused now (doing too many things at same time) on what is its purpose.

Ah, it is for when the input data is a single column. Then Z, or flags, option must be used to provide the remaining needed info.

option A too I guess? Like, counting values per node, or average/RMS/stdev, and all the other related things. Right? Or should blockmean be used instead? Or does it depend on source data being regularly spaced or not? I seem to get visually identical output for counting values per node with xyz2grd -An -I... -Goutgrid and with blockmean -A -Sn -I... -Goutgrid for irregular sonar depth data in my case.

And thanks for explaining anyway. This thing does sound confusing.

also xyz2rgd’s -D option can be used to specify variable names, scales, dimensions etc for the grid output file, blockmean seems lacking this capacity.

No (but this is my manual reading interpretation), -A is not the same as the block’s because here (xyz2grd) data must lay already on grid nodes, whilest the block's modules are intended for scattered data and some statistic is applied on a per cell (or bin) area. -D is new material that has been added much more recently to deal also with the creation of grid cubes that the block's cannot deal with.

well xyz2grd anyway demands that -I... is specified:

gmt xyz2grd tmp_Kungsviken/sonar_points_Kungsviken.txt -R11:34/11:35:30/58:13:20/58:14:20 -Gtest_xyz2grd_Kungsviken.nc
xyz2grd [ERROR]: Option -I: Must specify positive increment(s)

Hmm something to check with a debug session to see if it’s being overzealous. And does it care of the value given in -I?

FYI, if you rename the file to sonar_points_Kungsviken.xyz a GDAL driver jumps in and that file is taken as a grid directly.

$ gmt xyz2grd  -Vd tmp_Kungsviken/sonar_points_Kungsviken.txt -R11:34/11:35:30/58:13:20/58:14:20 -Gtest_xyz2grd_Kungsviken.nc
gmt [DEBUG]: GMT_Create_Session: Terminal width = 80
gmt [DEBUG]: Obtained the ppid from parent: 3662509
gmt [DEBUG]: Enter: gmtinit_new_GMT_ctrl
gmt [DEBUG]: GMT->session.SHAREDIR = /home/mkononets/mambaforge/envs/pygmt/share/gmt
gmt [DEBUG]: GMT->session.HOMEDIR = /home/mkononets
gmt [DEBUG]: GMT->session.USERDIR = /home/mkononets/.gmt [created]
gmt [DEBUG]: GMT->session.CACHEDIR = /home/mkononets/.gmt/cache [created]
gmt [DEBUG]: GMT: 0. Will try to find subdir=postscriptlight stem = PSL_custom_fonts suffix=.txt
gmt [DEBUG]: GMT: 1. gmt_getsharepath trying current dir
gmt [DEBUG]: GMT: 2. gmt_getsharepath trying USERDIR /home/mkononets/.gmt
gmt [DEBUG]: GMT: 3. gmt_getsharepath trying USERDIR subdir /home/mkononets/.gmt/postscriptlight
gmt [DEBUG]: GMT: 4. gmt_getsharepath trying SHAREDIR subdir /home/mkononets/mambaforge/envs/pygmt/share/gmt/postscriptlight
gmt [DEBUG]: GMT: 5. gmt_getsharepath trying SHAREDIR /home/mkononets/mambaforge/envs/pygmt/share/gmt
gmt [DEBUG]: GMT: 6. gmt_getsharepath failed
gmt [DEBUG]: Map distance calculation will be Cartesian
gmt [DEBUG]: Exit:  gmtinit_new_GMT_ctrl
gmt [DEBUG]: Enter: New_PSL_Ctrl
gmt [DEBUG]: Exit:  New_PSL_Ctrl
gmt [DEBUG]: Enter: gmt_manage_workflow
gmt [DEBUG]: Exit : gmt_manage_workflow
gmt [DEBUG]: Enter: PSL_beginsession
gmt [DEBUG]: Exit : PSL_beginsession
gmt [DEBUG]: Enter: PSL_setdefaults
gmt [DEBUG]: Exit : PSL_setdefaults
gmt [DEBUG]: Enter: gmtlib_io_init
gmt [DEBUG]: Exit : gmtlib_io_init
gmt [DEBUG]: Enter: gmt_hash_init
gmt [DEBUG]: Exit:  gmt_hash_init
gmt [DEBUG]: Enter: gmt_hash_init
gmt [DEBUG]: Exit:  gmt_hash_init
gmt [DEBUG]: Enter: gmt_reload_settings
gmt [DEBUG]: The PROJ_GEODESIC set to Vincenty
gmt [DEBUG]: Look for file /home/mkononets/gmt.conf
gmt [DEBUG]: Look for file /home/mkononets/.gmt/gmt.conf
gmt [DEBUG]: Look for file /home/mkononets/.gmt/server/gmt.conf
gmt [DEBUG]: Look for file /home/mkononets/.gmt/cache/gmt.conf
gmt [DEBUG]: Could not find file gmt.conf
gmt [DEBUG]: Exit:  gmt_reload_settings
gmt [DEBUG]: Enter: gmtlib_plot_C_format
gmt [DEBUG]: Exit:  gmtlib_plot_C_format
gmt [DEBUG]: Enter: gmtinit_get_history
gmt [DEBUG]: Enter: gmt_hash_init
gmt [DEBUG]: Exit:  gmt_hash_init
gmt [DEBUG]: Exit:  gmtinit_get_history
gmt [DEBUG]: Initialize FFTW with 4 threads.
gmt [DEBUG]: GMT_Create_Session initialized GMT structure
gmt [DEBUG]: Loading core GMT shared library: libgmt.so
gmt [DEBUG]: Shared Library # 0 (core). Path = libgmt.so
gmt [DEBUG]: Loading GMT plugins from: /home/mkononets/mambaforge/envs/pygmt/lib/gmt/plugins
gmt [DEBUG]: Shared Library # 1 (supplements). Path = /home/mkononets/mambaforge/envs/pygmt/lib/gmt/plugins/supplements.so
gmt [DEBUG]: Revised options: tmp_Kungsviken/sonar_points_Kungsviken.txt -R11:34/11:35:30/58:13:20/58:14:20 -Gtest_xyz2grd_Kungsviken.nc -Vd
xyz2grd [DEBUG]: History: Process -R11:34/11:35:30/58:13:20/58:14:20
xyz2grd [DEBUG]: Got regular w/e/s/n for region (11:34/11:35:30/58:13:20/58:14:20)
xyz2grd [ERROR]: Option -I: Must specify positive increment(s)
gmt [DEBUG]: Entering GMT_Destroy_Session

Yes it does. below is gmt grdinfo for the grid created using -I1s in addition to the above. x_inc and y_inc are both 0.000277777777778 which is 1 arc second as requested.

gmt grdinfo test_xyz2grd_Kungsviken.nc
test_xyz2grd_Kungsviken.nc: Title: 
test_xyz2grd_Kungsviken.nc: Command: gmt xyz2grd tmp_Kungsviken/sonar_points_Kungsviken.txt -R11:34/11:35:30/58:13:20/58:14:20 -Gtest_xyz2grd_Kungsviken.nc -I1s
test_xyz2grd_Kungsviken.nc: Remark: 
test_xyz2grd_Kungsviken.nc: Gridline node registration used [Cartesian grid]
test_xyz2grd_Kungsviken.nc: Grid file format: nf = GMT netCDF format (32-bit float), CF-1.7
test_xyz2grd_Kungsviken.nc: x_min: 11.5666666667 x_max: 11.5916666667 x_inc: 0.000277777777778 name: x n_columns: 91
test_xyz2grd_Kungsviken.nc: y_min: 58.2222222222 y_max: 58.2388888889 y_inc: 0.000277777777778 name: y n_rows: 61
test_xyz2grd_Kungsviken.nc: v_min: 5.88666677475 v_max: 46.7825012207 name: z
test_xyz2grd_Kungsviken.nc: scale_factor: 1 add_offset: 0
test_xyz2grd_Kungsviken.nc: format: classic
test_xyz2grd_Kungsviken.nc: Default CPT: 

Well sonar_points_Kungsviken.txt was at least not supposed to be a grid. It however appears to be somewhat grid-like, with unstable y_inc of 0.0000084 or 0.0000083 degrees (about 0.92 meters) and maybe something else. Just happened to notice.

Trying to run gmt grdinfo sonar_points_Kungsviken.xyz resulted in an error message from GDAL: ERROR 1: Ungridded dataset: At line 58, too many stepY values, same if I call gdalinfo sonar_points_Kungsviken.xyz. Full debug output below, probably not very informative.

gmt grdinfo sonar_points_Kungsviken.xyz -Vd
gmt [DEBUG]: GMT_Create_Session: Terminal width = 80
gmt [DEBUG]: Obtained the ppid from parent: 3662509
gmt [DEBUG]: Enter: gmtinit_new_GMT_ctrl
gmt [DEBUG]: GMT->session.SHAREDIR = /home/mkononets/mambaforge/envs/pygmt/share/gmt
gmt [DEBUG]: GMT->session.HOMEDIR = /home/mkononets
gmt [DEBUG]: GMT->session.USERDIR = /home/mkononets/.gmt [created]
gmt [DEBUG]: GMT->session.CACHEDIR = /home/mkononets/.gmt/cache [created]
gmt [DEBUG]: GMT: 0. Will try to find subdir=postscriptlight stem = PSL_custom_fonts suffix=.txt
gmt [DEBUG]: GMT: 1. gmt_getsharepath trying current dir
gmt [DEBUG]: GMT: 2. gmt_getsharepath trying USERDIR /home/mkononets/.gmt
gmt [DEBUG]: GMT: 3. gmt_getsharepath trying USERDIR subdir /home/mkononets/.gmt/postscriptlight
gmt [DEBUG]: GMT: 4. gmt_getsharepath trying SHAREDIR subdir /home/mkononets/mambaforge/envs/pygmt/share/gmt/postscriptlight
gmt [DEBUG]: GMT: 5. gmt_getsharepath trying SHAREDIR /home/mkononets/mambaforge/envs/pygmt/share/gmt
gmt [DEBUG]: GMT: 6. gmt_getsharepath failed
gmt [DEBUG]: Map distance calculation will be Cartesian
gmt [DEBUG]: Exit:  gmtinit_new_GMT_ctrl
gmt [DEBUG]: Enter: New_PSL_Ctrl
gmt [DEBUG]: Exit:  New_PSL_Ctrl
gmt [DEBUG]: Enter: gmt_manage_workflow
gmt [DEBUG]: Exit : gmt_manage_workflow
gmt [DEBUG]: Enter: PSL_beginsession
gmt [DEBUG]: Exit : PSL_beginsession
gmt [DEBUG]: Enter: PSL_setdefaults
gmt [DEBUG]: Exit : PSL_setdefaults
gmt [DEBUG]: Enter: gmtlib_io_init
gmt [DEBUG]: Exit : gmtlib_io_init
gmt [DEBUG]: Enter: gmt_hash_init
gmt [DEBUG]: Exit:  gmt_hash_init
gmt [DEBUG]: Enter: gmt_hash_init
gmt [DEBUG]: Exit:  gmt_hash_init
gmt [DEBUG]: Enter: gmt_reload_settings
gmt [DEBUG]: The PROJ_GEODESIC set to Vincenty
gmt [DEBUG]: Look for file /home/mkononets/gmt.conf
gmt [DEBUG]: Look for file /home/mkononets/.gmt/gmt.conf
gmt [DEBUG]: Look for file /home/mkononets/.gmt/server/gmt.conf
gmt [DEBUG]: Look for file /home/mkononets/.gmt/cache/gmt.conf
gmt [DEBUG]: Could not find file gmt.conf
gmt [DEBUG]: Exit:  gmt_reload_settings
gmt [DEBUG]: Enter: gmtlib_plot_C_format
gmt [DEBUG]: Exit:  gmtlib_plot_C_format
gmt [DEBUG]: Enter: gmtinit_get_history
gmt [DEBUG]: Enter: gmt_hash_init
gmt [DEBUG]: Exit:  gmt_hash_init
gmt [DEBUG]: Exit:  gmtinit_get_history
gmt [DEBUG]: Initialize FFTW with 4 threads.
gmt [DEBUG]: GMT_Create_Session initialized GMT structure
gmt [DEBUG]: Loading core GMT shared library: libgmt.so
gmt [DEBUG]: Shared Library # 0 (core). Path = libgmt.so
gmt [DEBUG]: Loading GMT plugins from: /home/mkononets/mambaforge/envs/pygmt/lib/gmt/plugins
gmt [DEBUG]: Shared Library # 1 (supplements). Path = /home/mkononets/mambaforge/envs/pygmt/lib/gmt/plugins/supplements.so
gmt [DEBUG]: Revised options: sonar_points_Kungsviken.xyz -Vd
grdinfo [DEBUG]: Calling nc_open on sonar_points_Kungsviken.xyz, ncid = -16, err = -51
grdinfo [DEBUG]: Found readable file sonar_points_Kungsviken.xyz
grdinfo [DEBUG]: Replace file sonar_points_Kungsviken.xyz with path sonar_points_Kungsviken.xyz
grdinfo [DEBUG]: Replace file sonar_points_Kungsviken.xyz with sonar_points_Kungsviken.xyz
grdinfo [DEBUG]: Will write output record(s) with 0 leading numerical columns and with trailing text
grdinfo [DEBUG]: Number of numerical output columns has been set to 0
grdinfo [DEBUG]: gmtapi_init_export: Passed family = Data Table and geometry = Non-Geographical
grdinfo [DEBUG]: Object ID 0 : Registered Data Table Stream 7fe91d299780 as an Output resource with geometry Non-Geographical [n_objects = 1]
grdinfo [DEBUG]: gmtapi_init_export: Added stdout to registered destinations
grdinfo [DEBUG]: GMT_Init_IO: Returned first Output object ID = 0
grdinfo [DEBUG]: GMT_Begin_IO: Initialize record-by-record access for Output
grdinfo [DEBUG]: gmtapi_next_io_source: Selected object 0
grdinfo [INFORMATION]: Writing Data Table to Standard Output stream
grdinfo [DEBUG]: GMT_Begin_IO: Output resource access is now enabled [record-by-record]
grdinfo [DEBUG]: Found readable file sonar_points_Kungsviken.xyz
grdinfo [DEBUG]: Replace file sonar_points_Kungsviken.xyz with path sonar_points_Kungsviken.xyz
grdinfo [DEBUG]: Found readable file sonar_points_Kungsviken.xyz
grdinfo [DEBUG]: Replace file sonar_points_Kungsviken.xyz with path sonar_points_Kungsviken.xyz
grdinfo [DEBUG]: Found readable file sonar_points_Kungsviken.xyz
grdinfo [DEBUG]: Object ID 1 : Registered Grid File sonar_points_Kungsviken.xyz as an Input resource with geometry Surface [n_objects = 2]
grdinfo [DEBUG]: gmtapi_begin_io: Input resource access is now enabled [container]
grdinfo [DEBUG]: gmtapi_import_grid: Passed ID = 1 and mode = 1
grdinfo [DEBUG]: Found readable file sonar_points_Kungsviken.xyz
grdinfo [DEBUG]: Calling nc_open on sonar_points_Kungsviken.xyz, ncid = 0, err = -51
grdinfo [DEBUG]: Found readable file sonar_points_Kungsviken.xyz
grdinfo [DEBUG]: Calling nc_open on sonar_points_Kungsviken.xyz, ncid = 0, err = -51
grdinfo [DEBUG]: Found readable file sonar_points_Kungsviken.xyz
grdinfo [DEBUG]: Calling nc_open on sonar_points_Kungsviken.xyz, ncid = 0, err = -51
grdinfo [DEBUG]: Found readable file sonar_points_Kungsviken.xyz
grdinfo [DEBUG]: Calling nc_open on sonar_points_Kungsviken.xyz, ncid = 0, err = -51
grdinfo [DEBUG]: Found readable file sonar_points_Kungsviken.xyz
grdinfo [DEBUG]: Calling nc_open on sonar_points_Kungsviken.xyz, ncid = 0, err = -51
grdinfo [DEBUG]: Found readable file sonar_points_Kungsviken.xyz
grdinfo [DEBUG]: Calling nc_open on sonar_points_Kungsviken.xyz, ncid = 0, err = -51
grdinfo [DEBUG]: Found readable file sonar_points_Kungsviken.xyz
grdinfo [DEBUG]: Calling nc_open on sonar_points_Kungsviken.xyz, ncid = 0, err = -51
grdinfo [DEBUG]: Found readable file sonar_points_Kungsviken.xyz
grdinfo [DEBUG]: Look for file sonar_points_Kungsviken.hdr in /home/mkononets/.gmt
grdinfo [DEBUG]: Look for file sonar_points_Kungsviken.hdr in /home/mkononets/.gmt/cache
grdinfo [DEBUG]: Look for file sonar_points_Kungsviken.hdr in /home/mkononets/.gmt/server
grdinfo [DEBUG]: Found readable file sonar_points_Kungsviken.xyz
ERROR 1: Ungridded dataset: At line 58, too many stepY values
grdinfo (gmtapi_import_grid): Not a supported grid format [sonar_points_Kungsviken.xyz]
[Session gmt (0)]: Error returned from GMT API: GMT_GRID_READ_ERROR (18)
[Session gmt (0)]: Error returned from GMT API: GMT_GRID_READ_ERROR (18)
grdinfo [DEBUG]: gmtlib_unregister_io: Unregistering object no 1 [n_objects = 1]
grdinfo [DEBUG]: gmtlib_unregister_io: Object no 1 has non-NULL resource pointer
grdinfo [DEBUG]: gmtlib_unregister_io: Unregistering object no 0 [n_objects = 0]
gmt [DEBUG]: Entering GMT_Destroy_Session

Yes, I noticed that too. When I try to run the function without spacing=() it throws an error.
Anyways, @mkononets, thank you for pointing out the option in the documentation, no idea how I missed that.

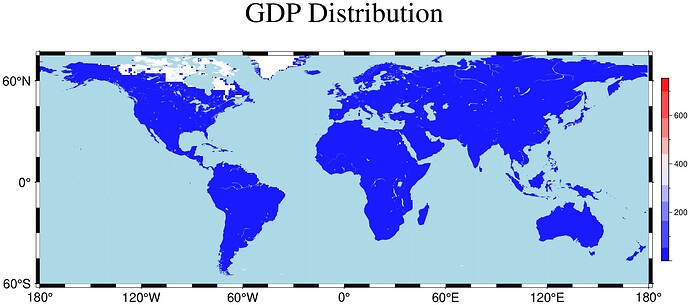
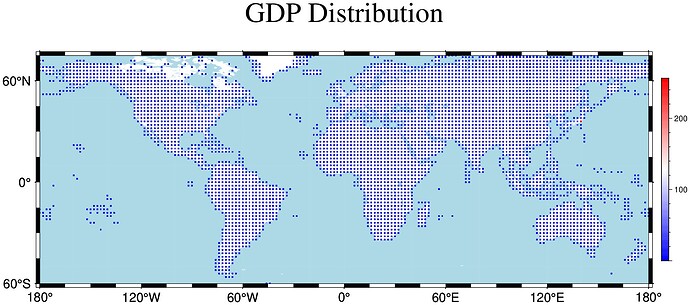
After some testing, I am not sure anymore whether grd2cpt is really doing what I want it to. Let me show you based on a different variable.
This map was created with grd2cpt:

This is the code:

gdp_grd = xyz2grd(gdp_df, region=(-180, 180, -60, 75), spacing=(1.0, 1.0))
gdp_grd = grdsample(gdp_grd)
C = grd2cpt(gdp_grd, cmap=:polar);
grdimage(gdp_grd, proj=:equidistCylindrical, title = "GDP Distribution", colorbar = true)
coast!(water="lightblue", savefig ="hist_gdp.jpg")

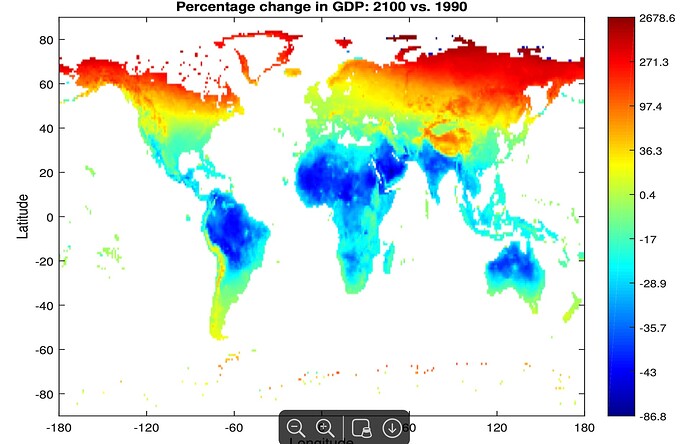
What I am trying to create is something more like:

Where each nlevel has an identical number of observations in it which grd2cpt does not seem to be doing.

Is this possible within GMT.jl using a different function or am I grossly misunderstanding how grd2cpt works?

EDIT: Sorry, I must have misunderstood what was being asked about -I... I have removed it to avoid confusion.

Then try skipping that coast!... call. Filling water using coast “clips” your grid to the coastline at a different spatial resolution as far as I can understand. You probably have choose a proper range for your color scale manually if there are some sort of outliers.

Or try to plot coast!... first, then your grid with transparency for NaNs: grdimage

  • Q or nan_alpha or alpha_color : – nan_alpha=true or alpha_color=true|(r,g,b)
    Make grid nodes with z = NaN transparent. If input is an image alpha_color picks one color (default is black) and makes it transparent (requires GMT6.2 and above).

EDIT or even without coast!... as you can obviously set a background color for NaNs.

And sorry for partially stealing your thread.

Ok, so it need -I after all to allow more than one data point to fal in the same grid node (I guess).

Data fed to xyz2grd must be already gridded. The different 0.0000084 or 0.0000083 probably result from truncation when file was written in limited precision ASCII, and likely that is why GDAL is complaining as well.

What is this intended to do?

Can you post the base data in a zip file?

I’m slightly out of the conversation, but

Sounds like binstat module more than xyz2grd. See the « heatmap » showcase (not the first post but further down the thread)

Yet another example that xyz2grd obviously does not need gridded input to do -A things.

Not for doing xyz2grd -A things.

From man

Note: xyz2grd does not grid the data, it simply reformats existing data to a grid structure.

and

-A[d|f|l|m|n|r|S|s|u|z]

By default we will calculate mean values if multiple entries fall on the same node. Use -A to change this behavior,…

I take it that change this behavior means computing other than the mean of repeated values on node.

You’re right, it doesn’t seem to be doing anything. After shifting my data 0.5 degrees north and east so that it aligns with the way GMT registers grids, my maps were looking odd, kind of like this:

I thought that resampling the grid to pixel registration fixed it, but I am now realizing that changing region=(-180, 180, -60, 75) to region = (-175.5, 175.5, -55.5, 83.5) when calling xyz2grd is what fixed the issue. Not sure why, but it seems to be working.

gdp_test_df.txt.zip (113.1 KB)

Here it is, thank you for taking a look.

I changed my code to

gdp_grd = xyz2grd(gdp_df, region=(-175.5, 175.5, -55.5, 83.5), spacing=(1.0, 1.0))
C = grd2cpt(gdp_grd, cmap=:polar);
coast(water="lightblue", region=(-180, 180, -60, 75), proj=:equidistCylindrical,)
grdimage!(gdp_grd,  title = "GDP Distribution", nan_alpha=true, colorbar = true, savefig ="hist_gdp.jpg")

But this doesn’t change the map at all. Also please don’t apologize for hijacking part of the thread. As a beginner, I’m learning a lot just trying to follow the conversation.

Maybe I am misunderstanding what gmtbinstats does, but I don’t need to compute statistics in a radius of the map. Instead, I want to be able to customize the amount of histogram bins that grd2cpt uses to make a cpt, so that I can show more variation in my data. For example, my cmap currently has ten distinct colors, and grd2cpt therefore separates my data into deciles automatically. What I am trying to do is to make it so that each of the 10 distinct colors has 10 shades, so that instead of deciles, the colors on the map are now showing percentiles. It looks like grd2cpt simply creates as many bins as there are colors in the provided cmap, so maybe the only way to change this is through defining a custom cmap with more colors.

I hope this makes sense and again, thank you everyone for contributing!